
Description
5dchart Add-in for Excel
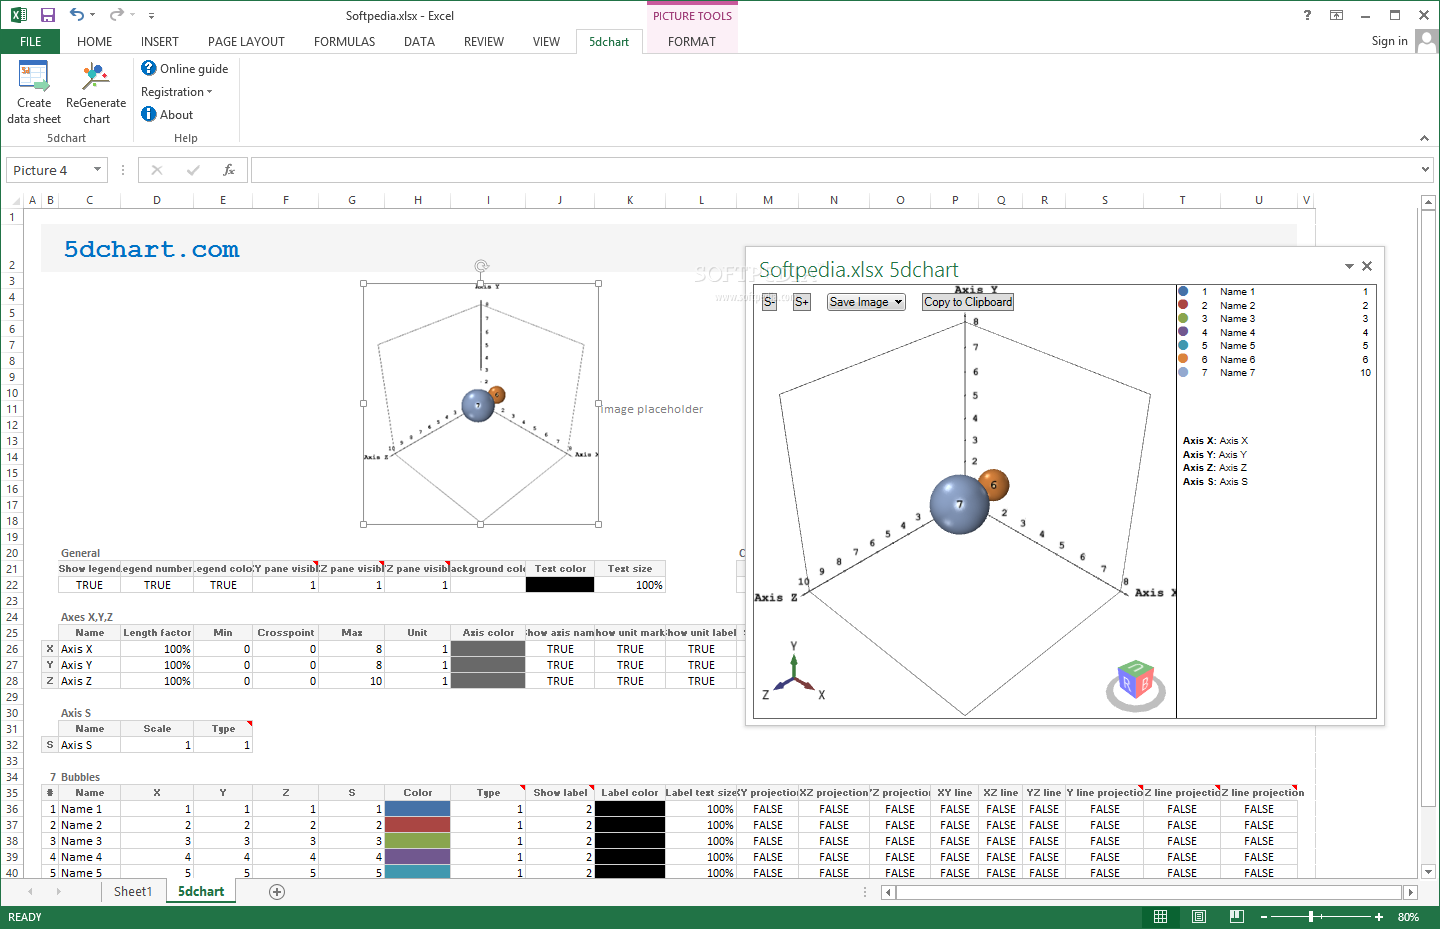
5dchart Add-in for Excel is a must-have tool if your job involves analyzing financial data, planning strategies, or creating scientific and building charts. It helps you display your data in a way that's super easy to understand.
Create Stunning Charts
This add-in works right inside Microsoft Excel, allowing you to whip up multidimensional graphs by just selecting multiple cells with numeric data. Isn't that cool?
User-Friendly Interface
You can find the tool right in the Excel toolbar, which makes it feel familiar. While you do need to type some parameters and values for those awesome 3D graphics, don't worry! The interface is really user-friendly, so even first-time users can create impressive scatter plots without breaking a sweat.
Control Your 3D Elements
The best part? You get complete control over all elements in a 3D space—like surface projections, axes, and positions. The final look of your chart depends on how well you input the right values. Once you're happy with it, you can easily copy the image to your clipboard!
Customize Your Scatter Plots
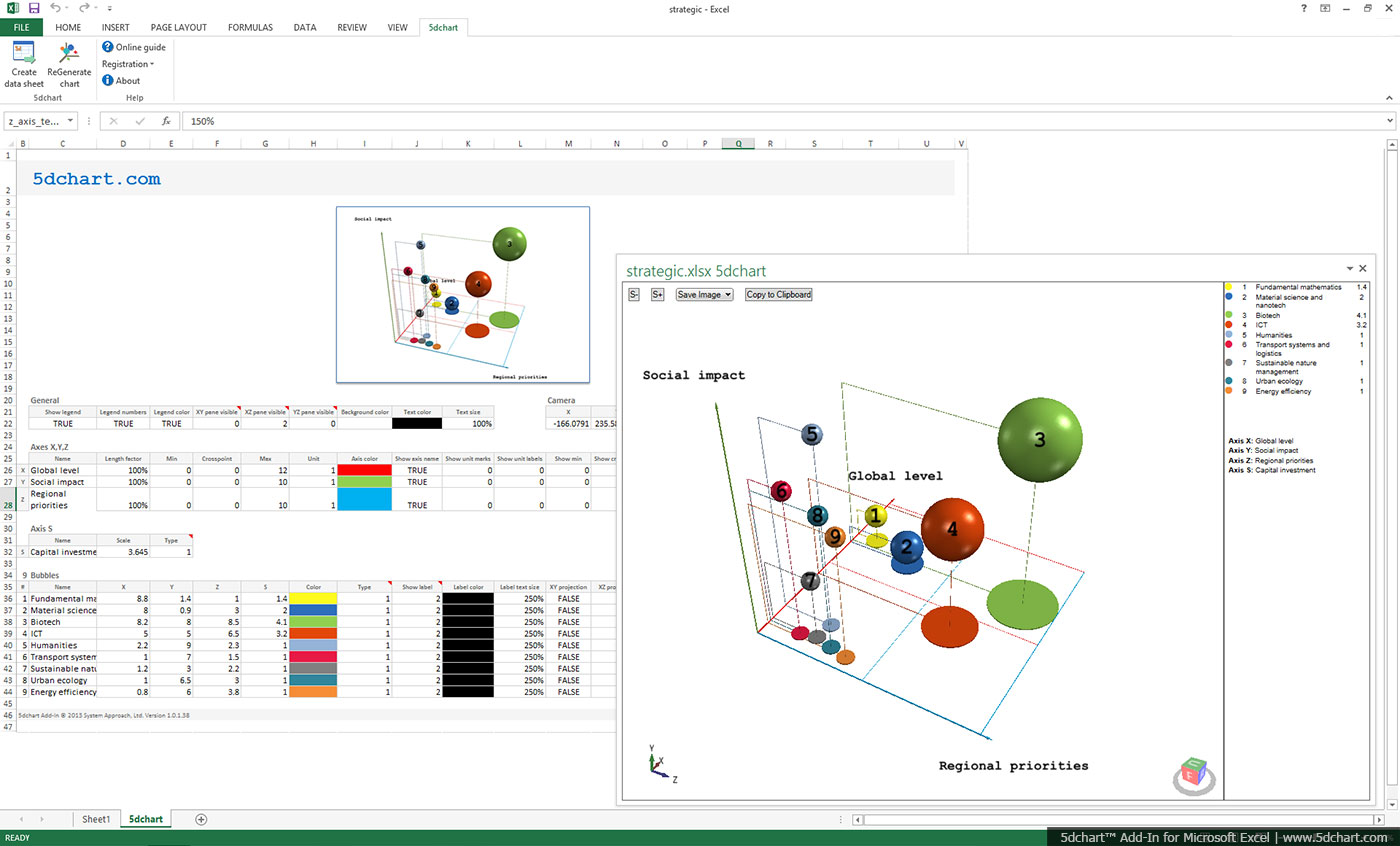
This tool doesn't just let you create 3D graphs; it also lets you specify coordinates, sizes, and colors of the bubbles in your scatter plot. This feature can be super handy when you're preparing a presentation where you want to highlight sales numbers or company profits during specific periods.
Getting Started with Data Sheets
Before diving into creating graphics, you'll need to set up a data sheet linked to your initial data. From there, you can customize your parameters before hitting that ReGenerate chart function to see your stunning 3D graph.
Why Use Graphs?
If you often work with large databases and analyze tons of information regularly, then graphic representations make everything easier to digest compared to plain lists. With 5dchart Add-in for Excel, displaying data as vibrant 3D bubbles will help you interpret everything faster!
Tags:
User Reviews for 5dchart Add-in for Excel 1
-
for 5dchart Add-in for Excel
5dchart Add-in for Excel simplifies creating impressive scatter plots in Excel. User-friendly UI makes generating multidimensional graphs a breeze.


