
Description
CapsGraph
CapsGraph is a super handy tool for making graphs from Windows packet capture files (WinPcap). Whether you’re a beginner or have some experience, you'll find it easy to use!
Create Cool Graphs with CapsGraph
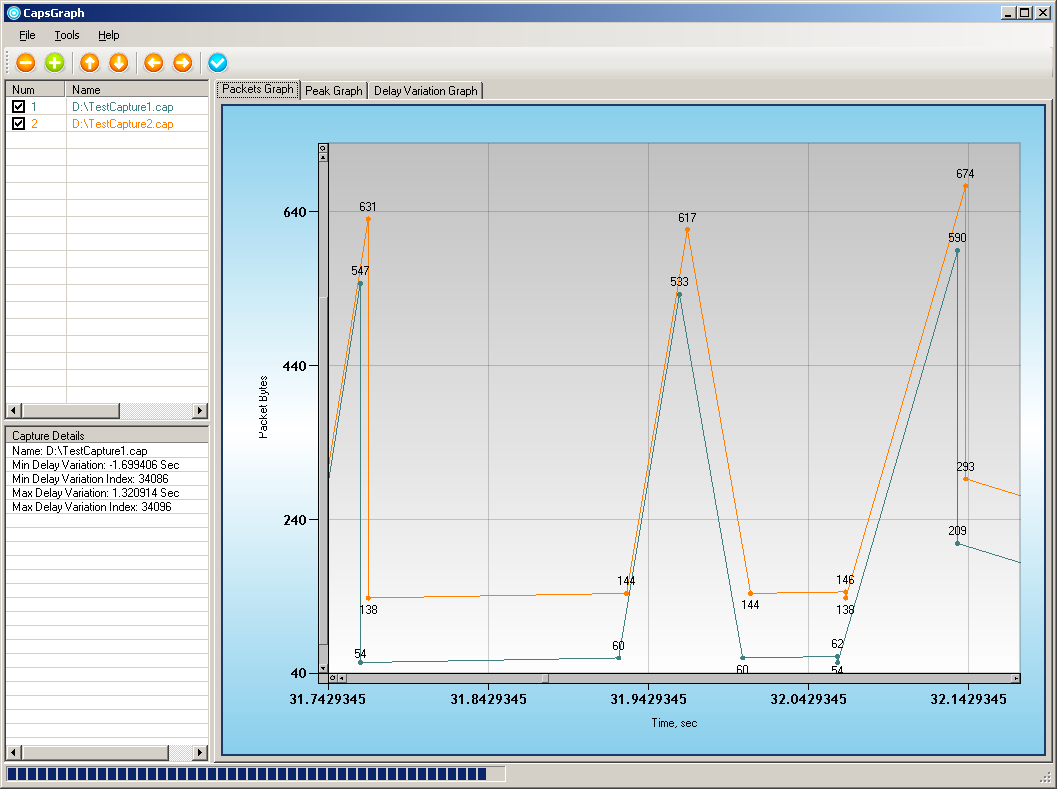
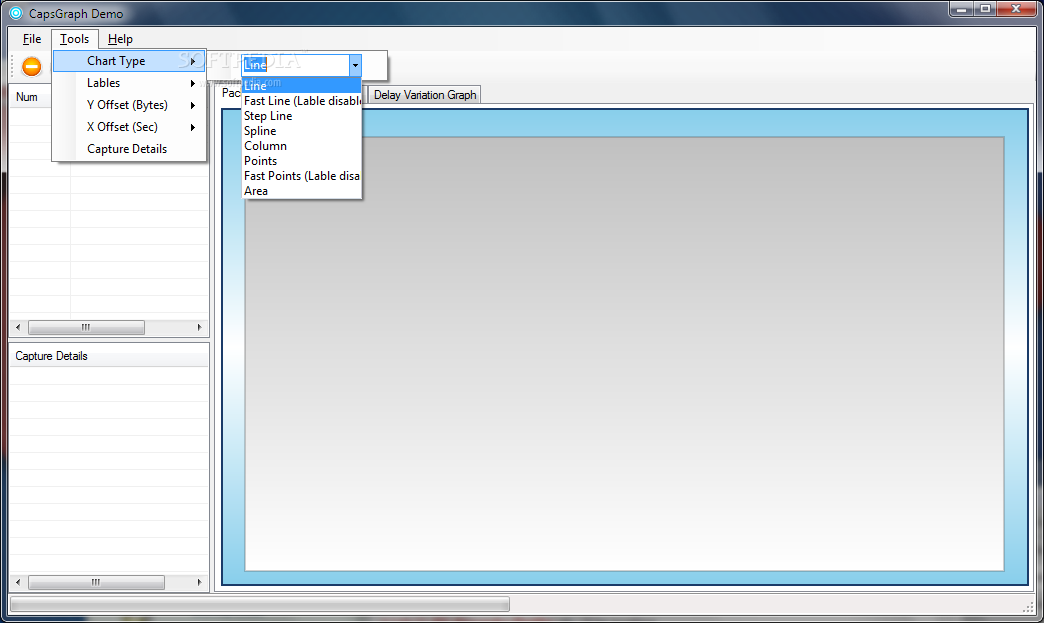
With CapsGraph, you can create some awesome graphs. You can choose different colors and pick from various chart types like Line, Column, Points, Spline, and Area. This makes it really fun to visualize your data in the way that works best for you.
Analyze Your Data Like a Pro
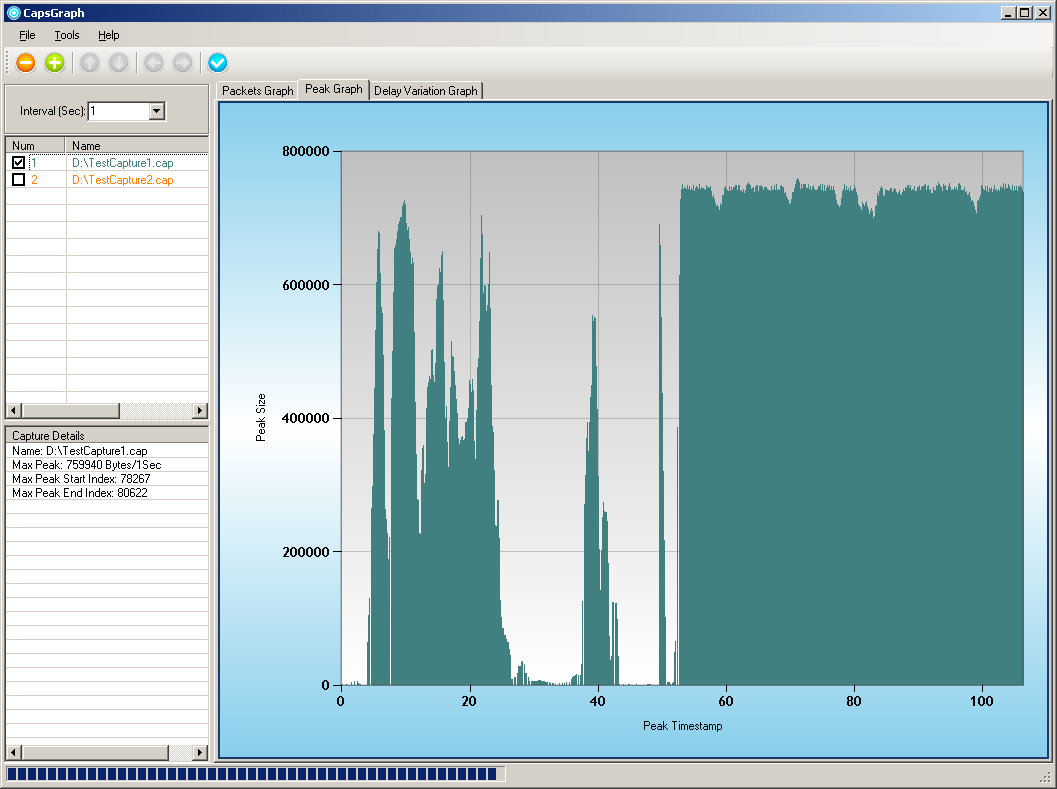
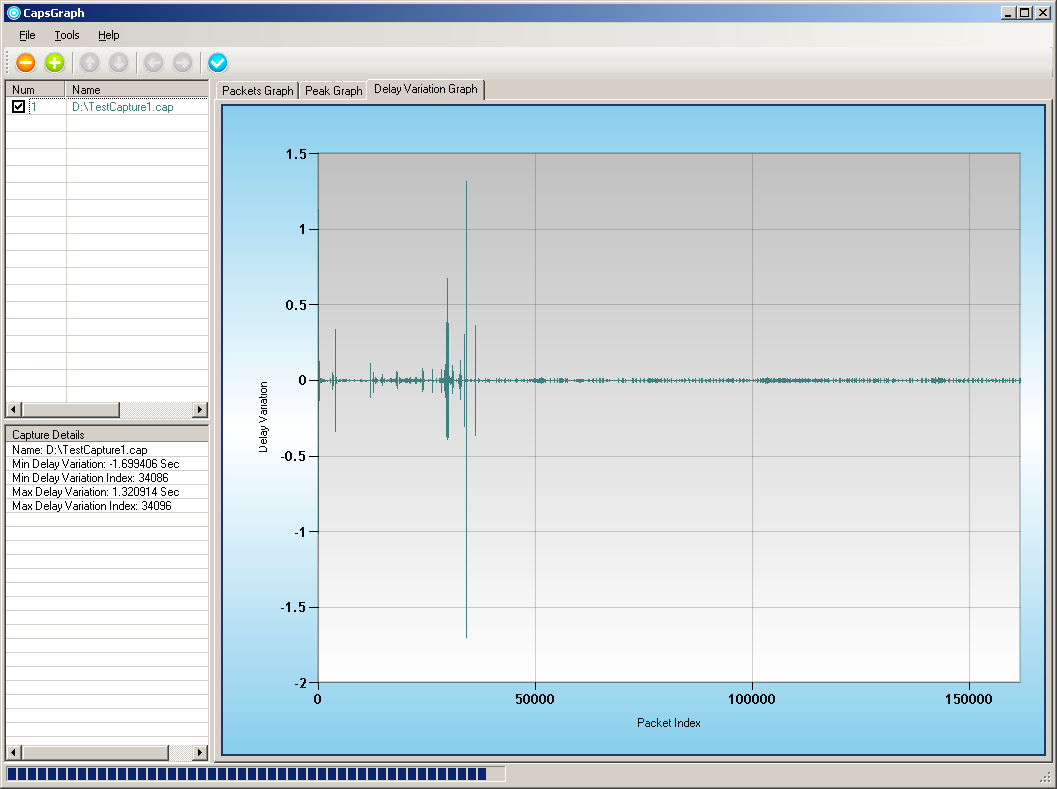
One of the coolest features of CapsGraph is that it lets you compare multiple capture files easily. Want to see how delays change over time? No problem! You can also measure peak rates for specific time intervals. It’s all about making sense of your data.
Labeling Made Easy
Another neat thing is that CapsGraph shows labels for each packet on your graph. You’ll get details like Packet Value, Index, Time Stamp, and the Time Stamp Delta between packets. This feature helps you understand exactly what's going on in your data.
Try It Out!
If you're curious about what CapsGraph can do for you, give it a try! It's a powerful tool that’s ready to help with your graphing needs. Whether it's for work or personal projects, this software has got your back!
User Reviews for CapsGraph 1
-
for CapsGraph
CapsGraph is a user-friendly tool for analyzing WinPcap files. It offers diverse chart types and correlation functionalities. Worth exploring!