
Description
EZ-R Excel
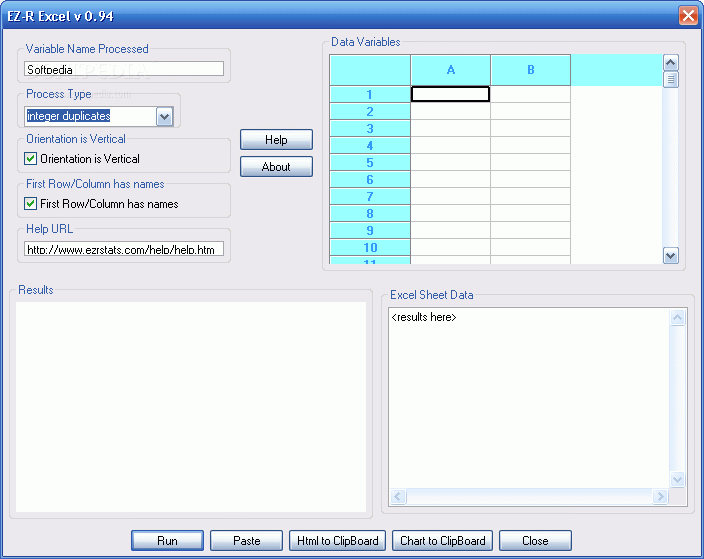
EZ-R Excel is a cool tool for analyzing data right from your Excel worksheets. To get started, you need to have both Excel and EZ-R Excel open at the same time. It’s super easy! Just select the data you want from your worksheet and copy it to your Windows clipboard.
How to Use EZ-R Excel
Once you've copied your data, you’ll paste it into EZ-R Excel. This is where the magic happens! You can analyze the data and create charts that make everything clearer. After you're done, you can view or copy those reports and charts back to your clipboard. Then, just paste them into other applications like Word or PowerPoint. Simple as that!
Key Features of EZ-R Excel
This software comes packed with some pretty neat features:
- Fraud Detection: It uses Benford's law to help spot any funny business in your numbers.
- Histograms: Easily visualize the frequency of your data.
- Univariate Statistics: Get deep insights into individual variables.
- Gap Detection: Find gaps in your data that might need attention.
- Frequency Distributions: Understand how often each value occurs.
- Outlier Detection: Identify any unusual values in your dataset.
- Simplified Summarization: Quickly summarize large datasets for easy reporting.
Your Next Steps
If you’re ready to take your data analysis up a notch, check out EZ-R Excel! You can download it by clicking on this link: E-Z R Excel. It’s a great way to make sense of all those numbers and turn them into something useful!
User Reviews for EZ-R Excel 1
-
for EZ-R Excel
EZ-R Excel is a robust tool for data analysis in Excel worksheets. Its features like fraud detection and histograms make it a valuable asset.