
Description
EZ-R Excel
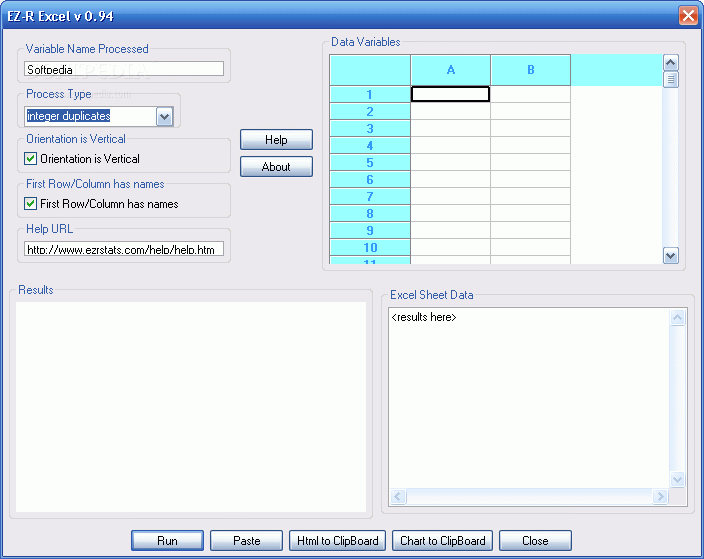
EZ-R Excel is a handy tool for analyzing data in your Excel worksheets. To get started, you need both Excel and EZ-R Excel open at the same time. It’s super easy! Just select the data you want from your worksheet, copy it to your Windows clipboard, and then paste it into EZ-R Excel for more analysis and charting.
How to Use EZ-R Excel
Once you’ve pasted your data into EZ-R Excel, you can create reports and charts that really stand out. The cool part? You can also copy these reports back to your clipboard so you can easily paste them into other applications whenever you need.
Key Features of EZ-R Excel
This software comes packed with some awesome features that make data analysis a breeze! Here’s what you can expect:
- Fraud Detection: Using Benford's Law, it helps spot unusual patterns in your data.
- Histograms: You can visualize frequency distributions with ease.
- Univariate Statistics: Analyze single variables to gain insights quickly.
- Gap Detection: Identify missing values or gaps in your data.
- Outlier Analysis: Find those unexpected values that could skew results.
- Summarization: Get concise summaries of your datasets effortlessly!
Your Next Steps!
If you're looking for a tool that simplifies data analysis, give EZ-R Excel a try! It combines great features with user-friendliness, making it an excellent choice for anyone who works with spreadsheets. Start getting more out of your data today!
User Reviews for EZ-R Excel 1
-
for EZ-R Excel
EZ-R Excel simplifies data analysis in Excel worksheets. Its fraud detection and summarization features make it a valuable tool for professionals.