
Description
Geographic Heat Map (India)
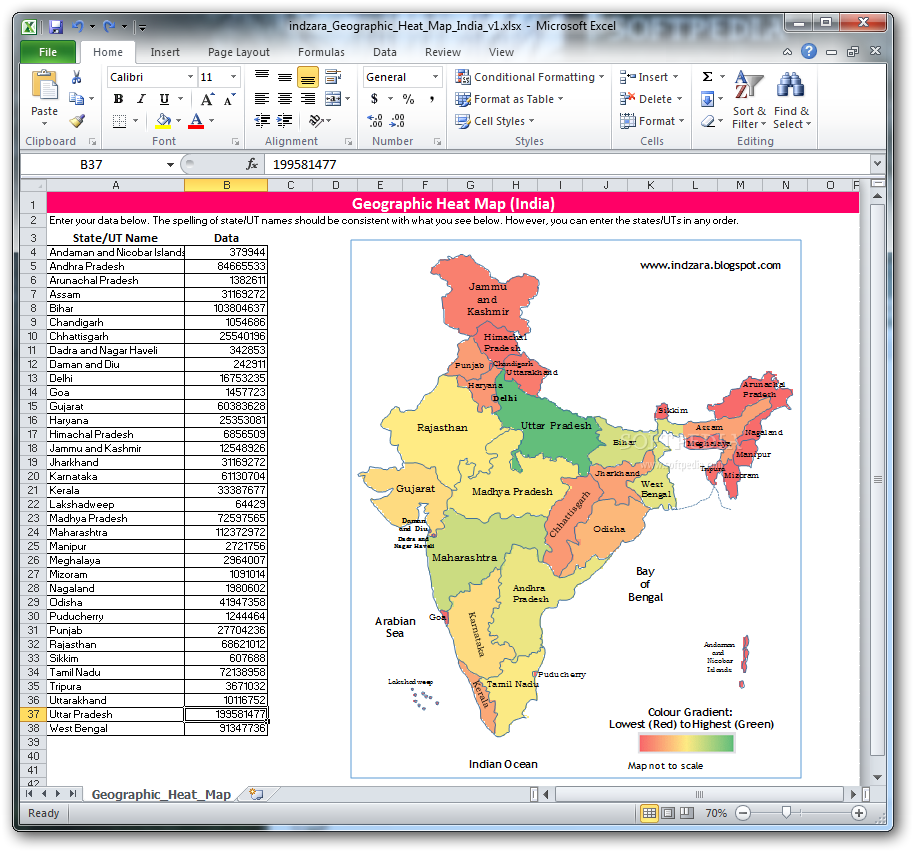
Geographic Heat Map (India) is a handy Excel template that helps you create cool graphical representations using the map of India. If you need to make a presentation and want to show data visually, this tool is perfect for you!
Create Stunning Maps Easily
This template makes it super easy to fill in your data. Just enter the numbers related to your presentation, and it will automatically whip up a heat map for you! No more struggling with complicated software.
Highlight Key Areas
You can really emphasize specific regions on the map by entering or pasting your data. For example, if you're looking at sales figures or population density, the heat map will help show which areas are above or below average at a glance.
User-Friendly Features
The Geographic Heat Map (India) template is designed with user-friendliness in mind. You don't need any special skills to use it! Just open Excel, plug in your info, and watch the magic happen.
Perfect for Presentations
This heat map template isn't just useful; it's also perfect for making presentations stand out. Whether you're in school or at work, being able to visualize your data makes it way easier for others to understand what you're talking about.
A Must-Have Tool
If you're looking for an effective way to present geographic data about India, this template should be on your list. It saves time and looks professional!
User Reviews for Geographic Heat Map (India) 1
-
for Geographic Heat Map (India)
Geographic Heat Map (India) is a user-friendly Excel template for creating graphical representations using the India map. Great tool for data visualization.