
Description
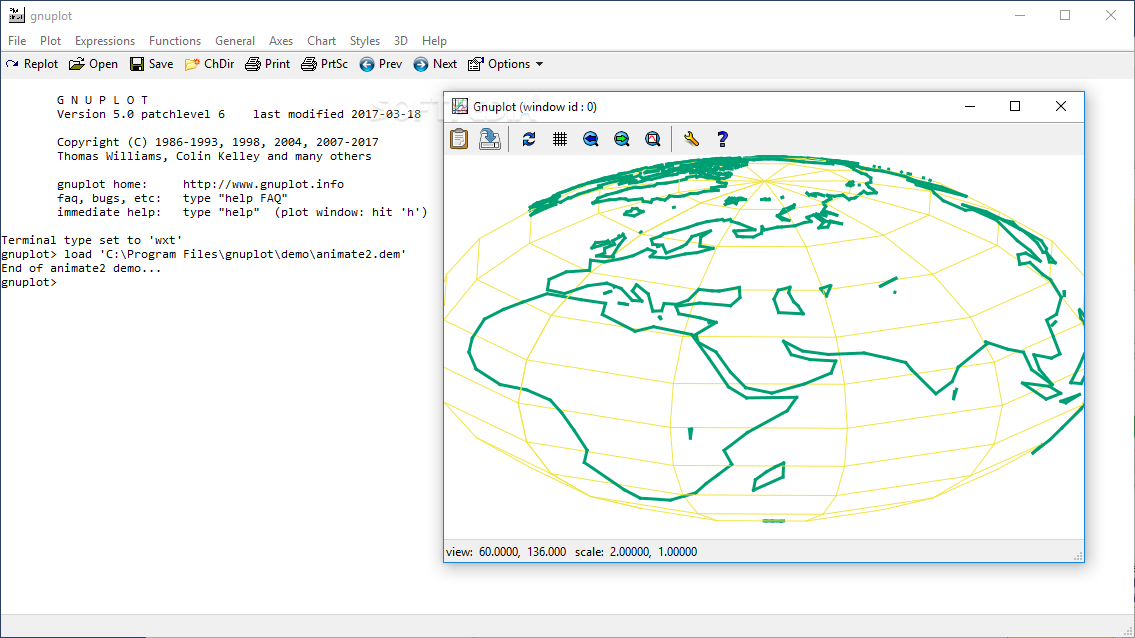
gnuplot
gnuplot is a super handy tool for scientists, engineers, and researchers who are swimming in data. You know how it can get overwhelming with tons of numbers? Well, graphic plots can really help make sense of all that info! They not only let you see the results better but also help spot patterns and trends that might be hiding in plain sight.
Why Use gnuplot?
This software is perfect for anyone working with big data—students and teachers included! Since it’s been around since 1986, gnuplot has built a solid reputation in the industry. Its long history means it's continuously being improved to meet users' needs.
User-Friendly Interfaces
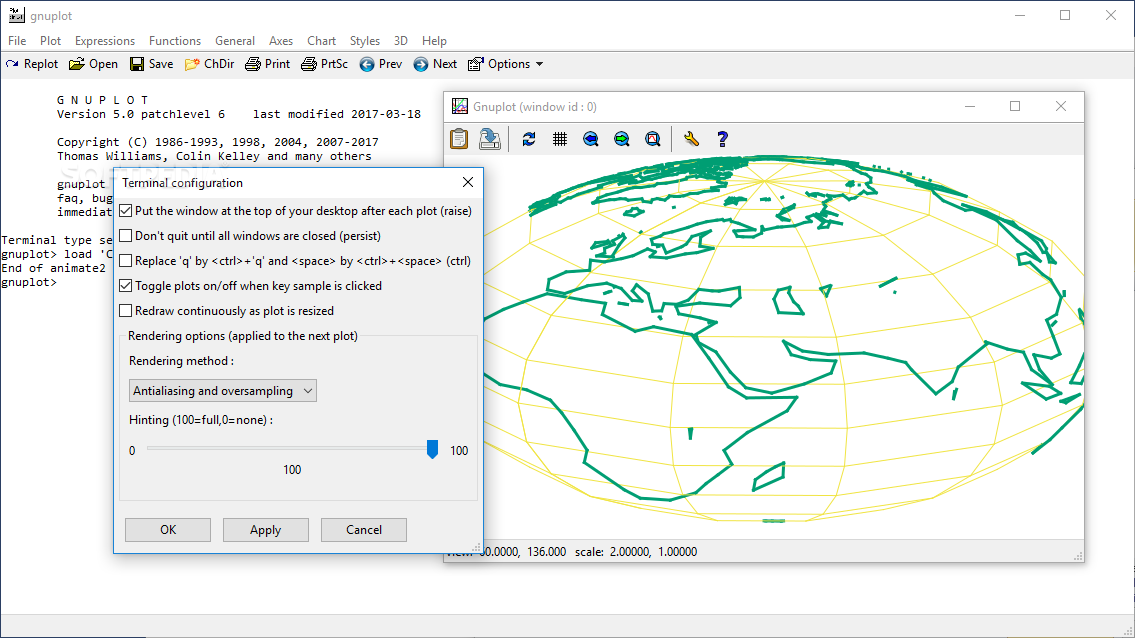
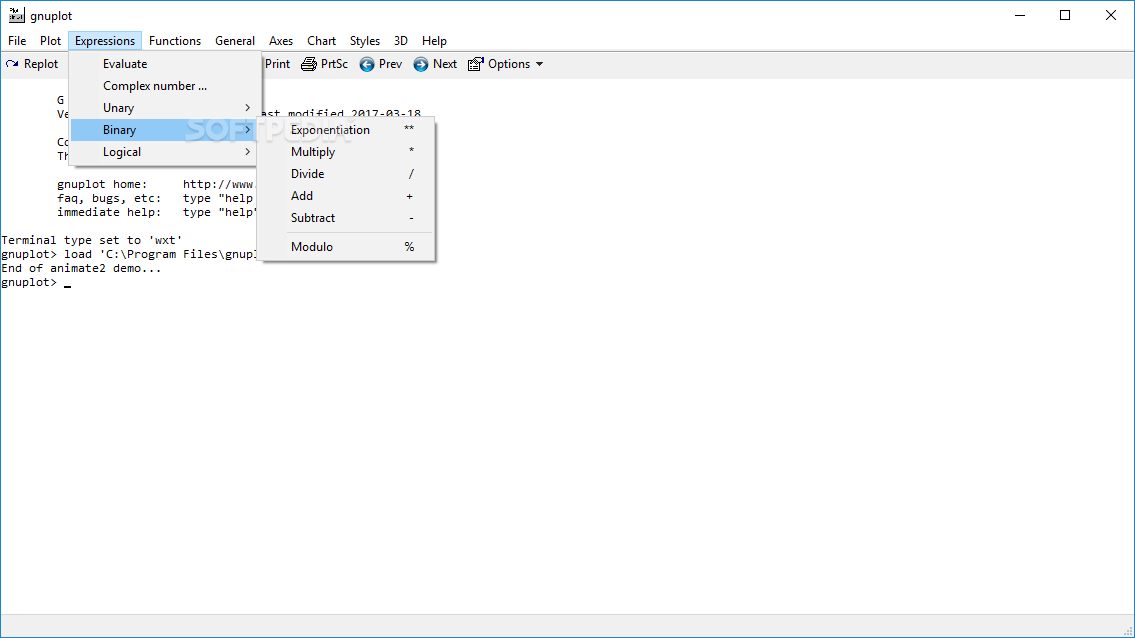
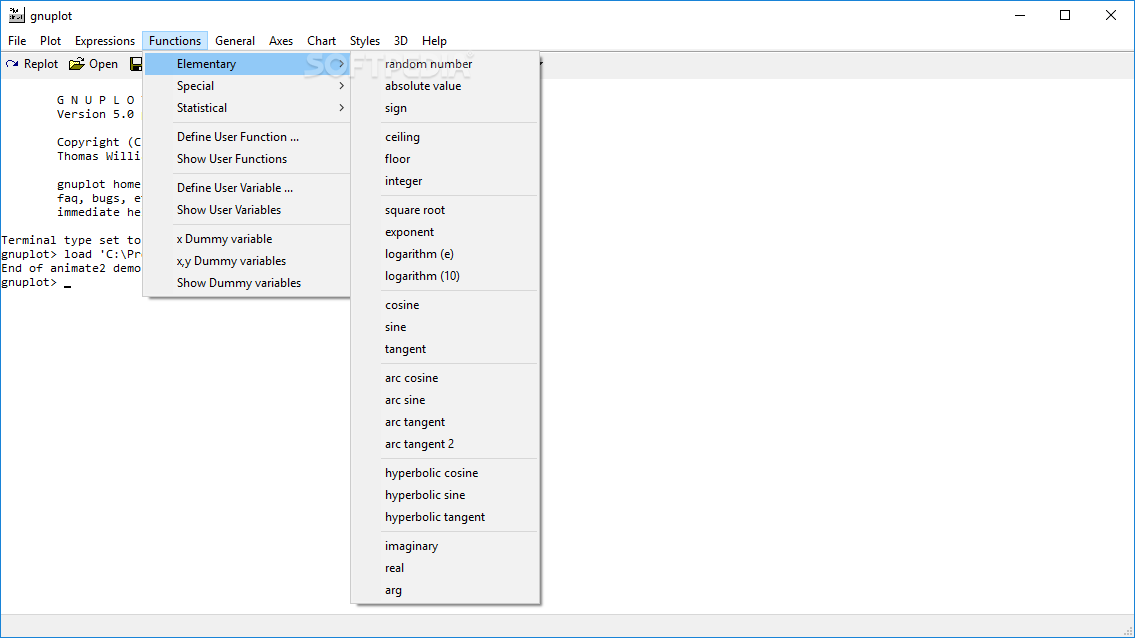
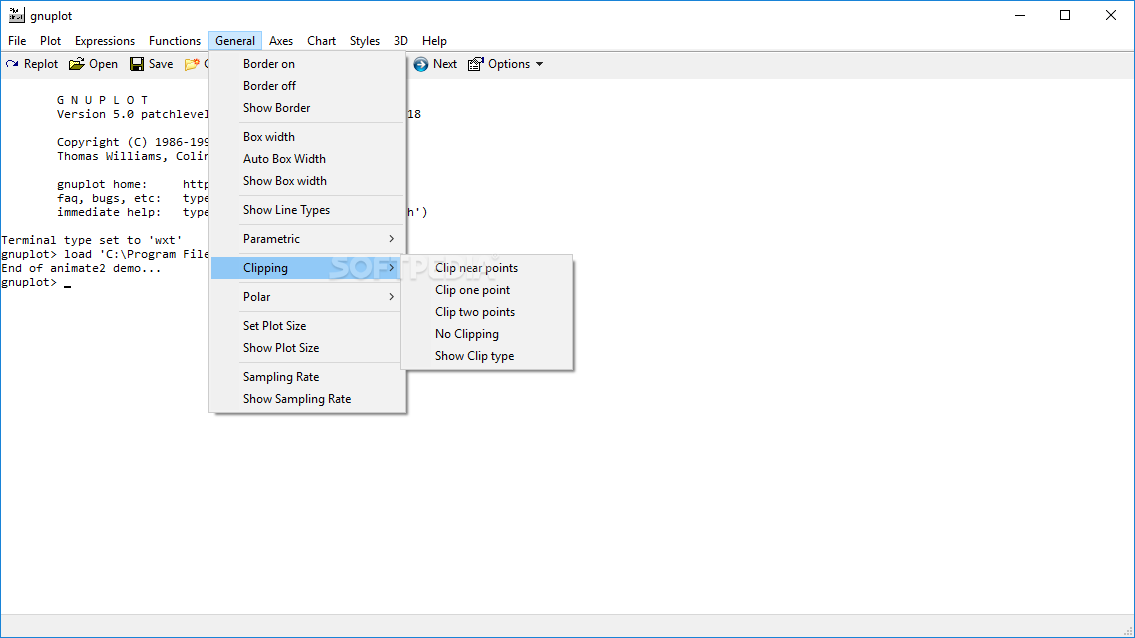
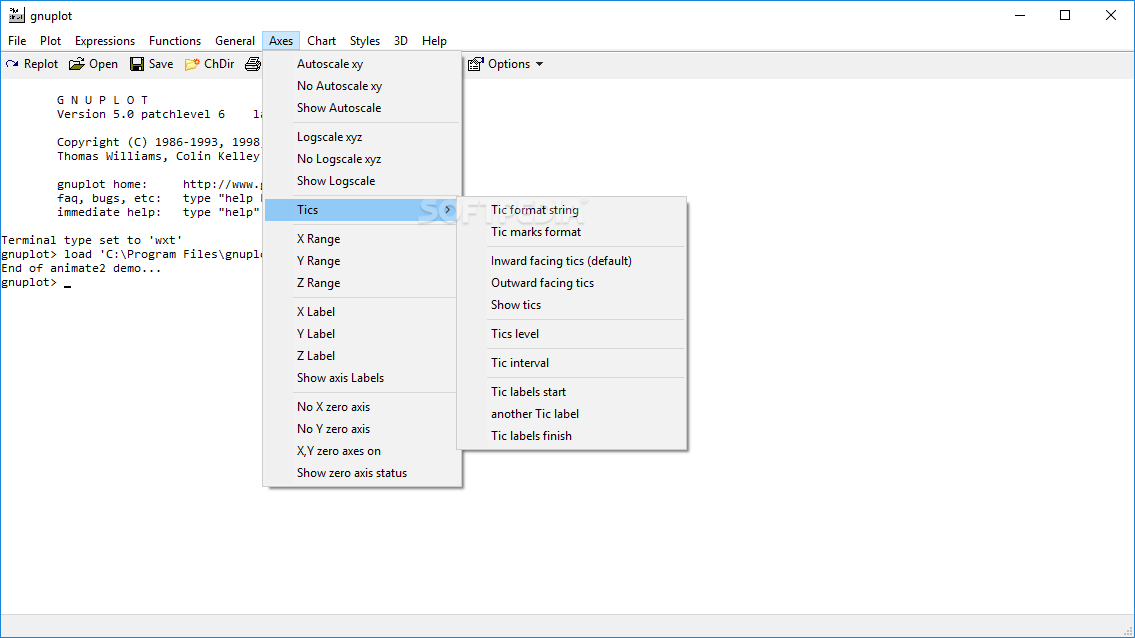
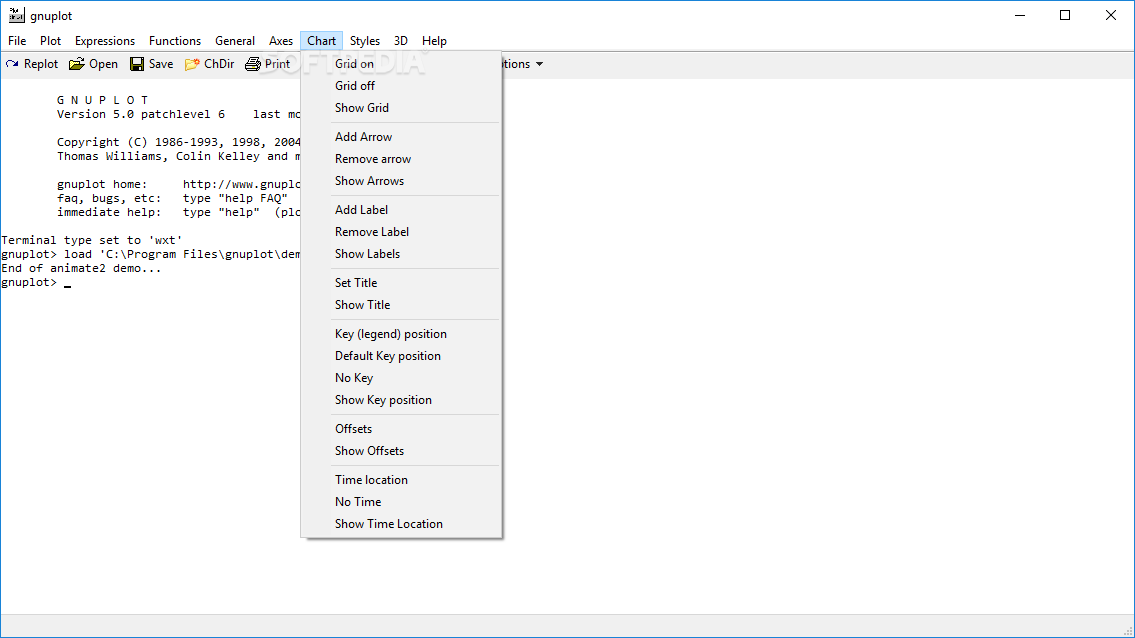
One of the cool things about gnuplot is that it offers both a graphic interface (GUI) and a command-line interface (CLI). The GUI is great for beginners because it's more user-friendly. You can easily enter commands and tweak your data sets. Want to load data from specific files or customize your plots? No problem!
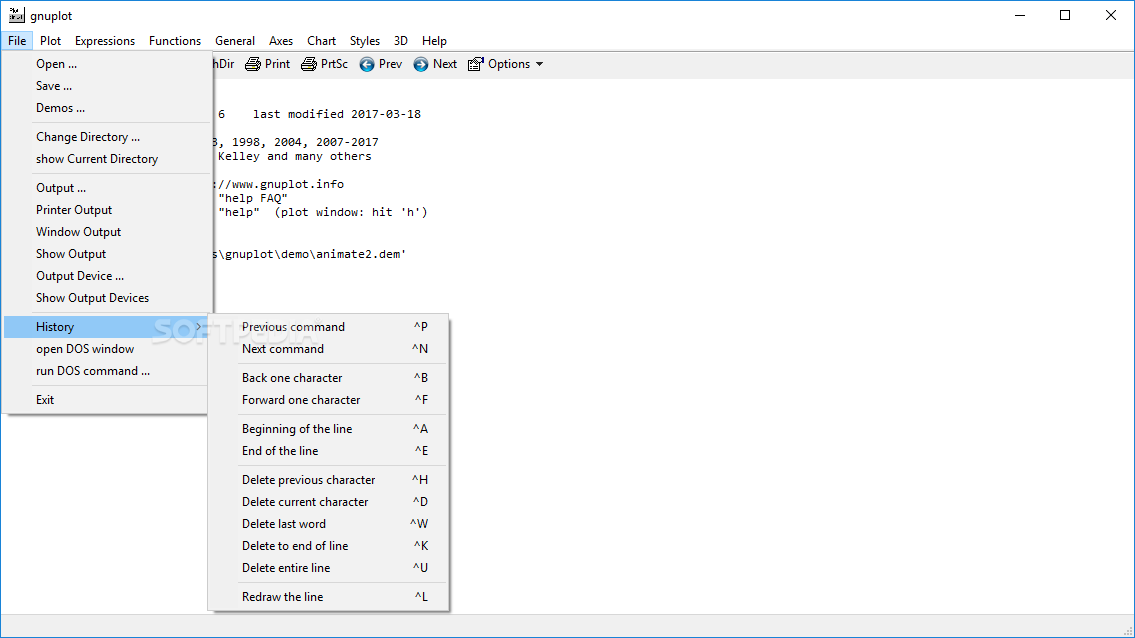
The CLI version, on the other hand, packs more powerful tools. It’s fantastic if you want to automate tasks or run scripts. So whether you prefer clicking buttons or typing commands, gnuplot has got you covered!
Create Stunning Plots
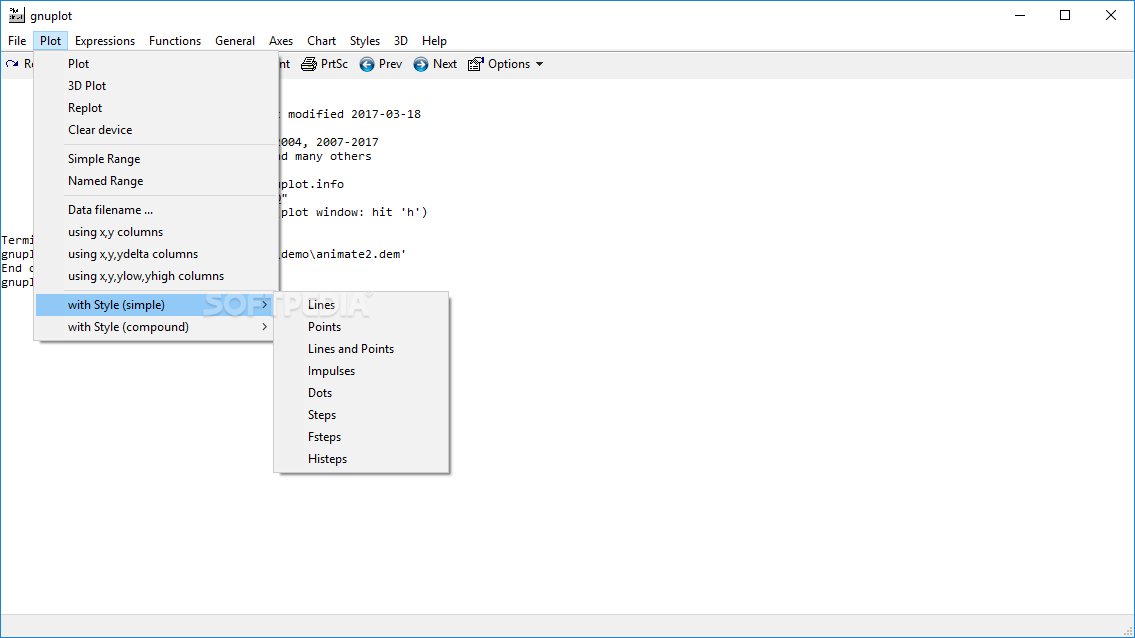
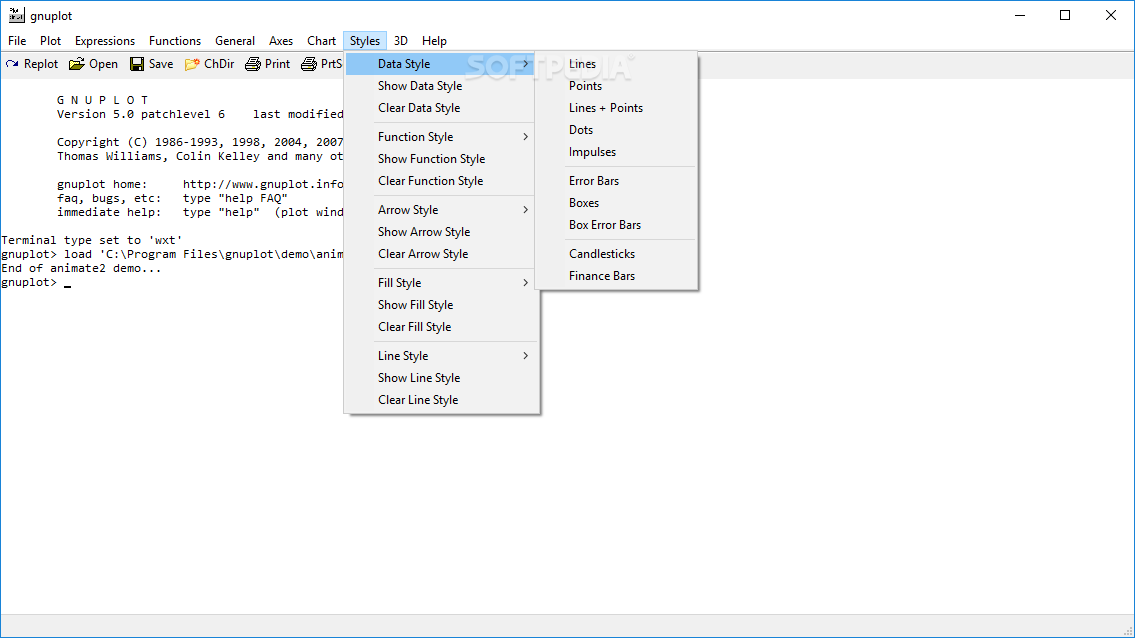
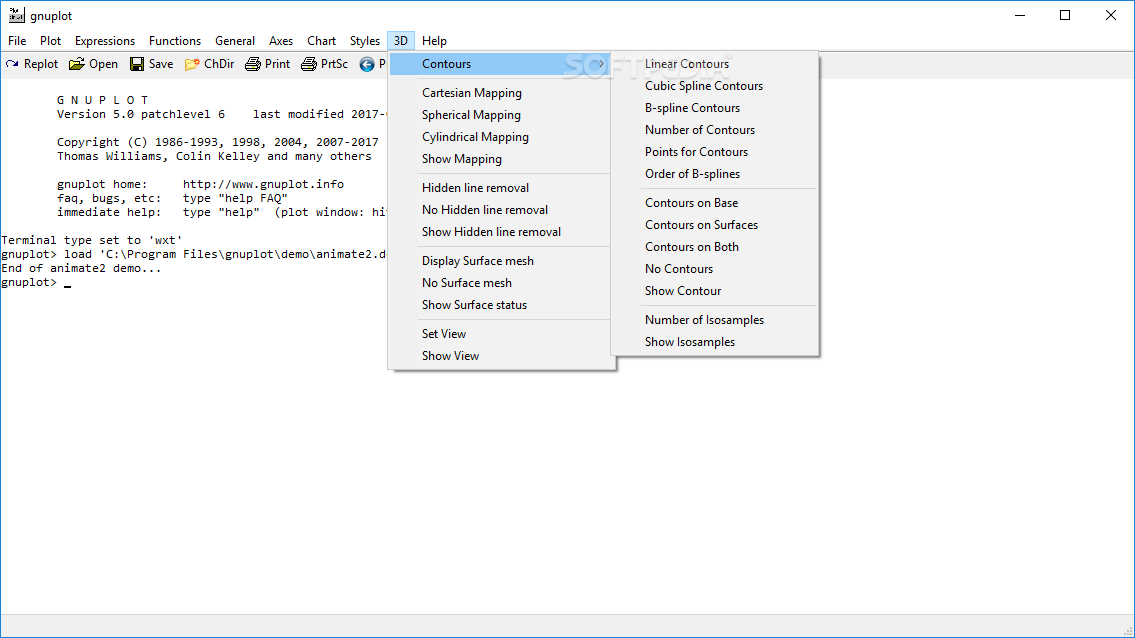
No matter where your data comes from, this app lets you whip up all sorts of 2D and 3D plots. You can add labels, legends, and other important details to make your graphs pop! Depending on what you're working on—like Physics or Economics—you can create line plots, scatter plots, bar charts, histograms, surface plots, contour plots, pie charts, box plots, or error bars.
Scripting Made Easy
A neat feature is that you can create scripts for gnuplot. This helps automate those repetitive steps in data analysis that nobody wants to do by hand! But just a heads-up: you'll need to learn some commands to get the best out of your graphs. It might take a little time to master them.
For All Scientific Fields
Overall, gnuplot is a reliable tool that's versatile enough for various scientific fields like Chemistry, Biology, Mathematics—you name it! It’s truly beneficial when dealing with large data sets.
If you're ready to dive in and start making amazing graphs with gnuplot, check it out now!
User Reviews for gnuplot 8
-
for gnuplot
gnuplot is a versatile tool for scientists and researchers to create precise 2D and 3D plots, aiding in data visualization and trend detection.
-
for gnuplot
Gnuplot offers powerful features for graph visualizations and scriptable interface.
-
for gnuplot
Gnuplot is an incredible tool for visualizing data! The variety of plot options is amazing, and it's very reliable.
-
for gnuplot
I've been using Gnuplot for my research, and it has transformed how I analyze data. The flexibility is top-notch!
-
for gnuplot
Absolutely love Gnuplot! It makes creating complex graphs so easy, and the automation features save me tons of time.
-
for gnuplot
Gnuplot is a game-changer for anyone working with large datasets. The graphical interface is user-friendly and powerful.
-
for gnuplot
This app is fantastic! Gnuplot allows me to create beautiful plots easily, making my presentations stand out.