
Description
Graph-A-Ping
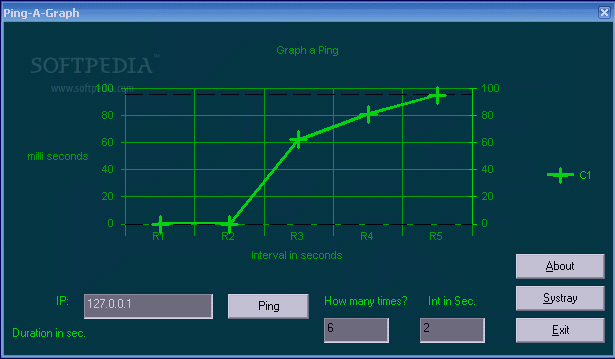
Graph-A-Ping is a handy tool that lets you see ping latency visually. This means you can easily spot any gaps between ping times, which helps identify potential network bottlenecks. If you're diving deeper into your network's performance, you can also check out more diagnostic tools at SoftPas.
What is Graph-A-Ping?
Graph-A-Ping is part of the Glass Net Networks monitoring console. What’s cool about Glass Net is that it lets you keep an eye on servers from anywhere! As long as those servers have an IP address reachable by Glass Net, you're good to go for remote monitoring.
User-Friendly Interface
The interface of Glass Net is super user-friendly and makes it easy to navigate through various functions. You won’t feel lost trying to figure things out! Plus, it comes with neat tools like the trace route graph, allowing you to visualize the route your data takes across networks.
Why Choose Graph-A-Ping?
If you're looking for a simple yet effective way to monitor your network performance, Graph-A-Ping has got your back. It’s perfect for spotting issues quickly and effectively!
Get Started with Graph-A-Ping
You can start using Graph-A-Ping today and take control of your network insights!
User Reviews for Graph-A-Ping 1
-
for Graph-A-Ping
Graph-A-Ping provides a clear visual representation of ping latency, helping users detect network bottlenecks efficiently. A useful tool for network analysis.