

Description
Graphis: Advanced Scientific Data Visualization Software - Download Now
Graphis software stands as a premier scientific and engineering data visualization tool that empowers researchers, engineers, and analysts to transform complex data into meaningful visual representations. This powerful application excels in creating both tabular and analytical curves, allowing users to plot data from tables or mathematical expressions with exceptional precision and flexibility.
When you download Graphis, you gain access to a comprehensive suite of visualization capabilities designed to handle the most demanding scientific data analysis tasks. Whether you're working with experimental results, simulation outputs, or theoretical models, Graphis provides the tools needed to generate compelling visual insights from your data.
Data Input and Management
Graphis offers multiple convenient methods for working with your data. Tabular curves can be created by manually entering values, pasting from applications like Excel, or importing from Graphis Spreadsheets. The spreadsheet functionality supports character-delimited text file imports through an intuitive Excel-like import interface, streamlining your data preparation workflow.
The analytical curve capabilities allow you to plot mathematical expressions directly, making it simple to visualize functions and compare theoretical models with empirical data. After you download Graphis, you'll appreciate how seamlessly it handles both data types in a unified environment.
Comprehensive Visualization Tools
2D Plotting Capabilities
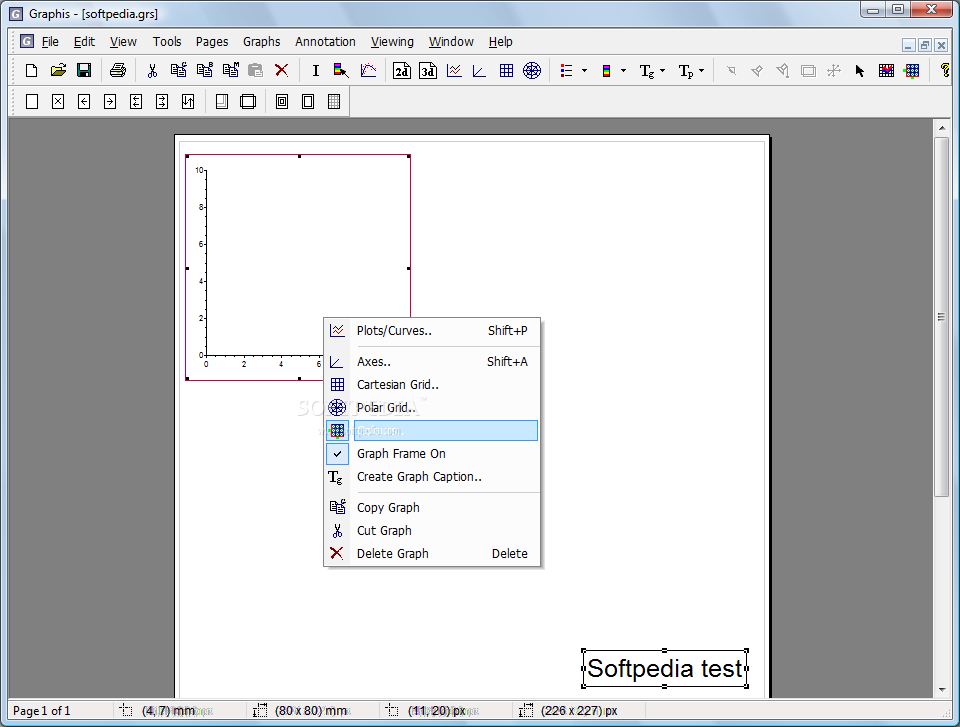
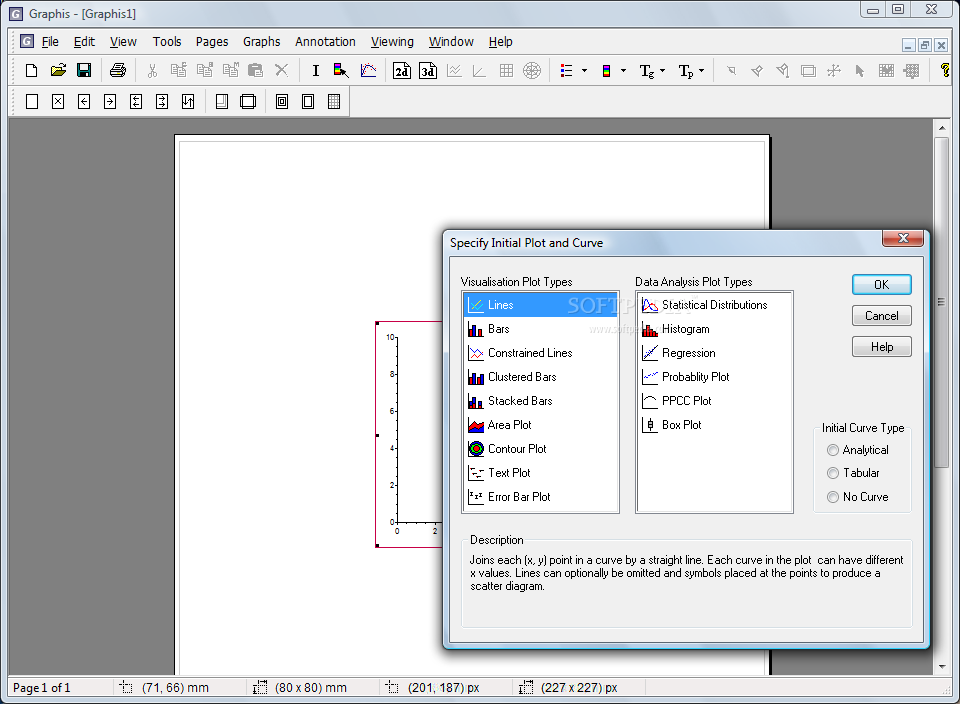
- 15 Diverse 2D Plot Types: Includes nine visualization plot types (line, area, bar, contour, text, error bar) and six data analysis plot types (statistical distributions, histograms, probability plots, box plots, curve fitting)
- Flexible Coordinate Systems: Plot in cartesian, polar, or parametric coordinates
- Advanced Axis Options: Support for logarithmic scaling and Date/Time axis labeling
3D Visualization Excellence
- 12 Powerful 3D Plot Types: Create surface plots, bar plots, line plots, scatter plots, 3D object plots, and mesh plots
- Enhanced Surface Rendering: Apply colormapping, texture mapping, transparency, and contour displays
- Object Manipulation: Position cubes, cylinders, spheres, and custom 3D objects with up to 8 translate/rotate/scale operations
- Multiple Coordinate Systems: Work in cartesian, polar, cylindrical, or parametric coordinates
- High-Quality Graphics: Powered by OpenGL for superior rendering and interactive manipulation
Advanced Analysis Features
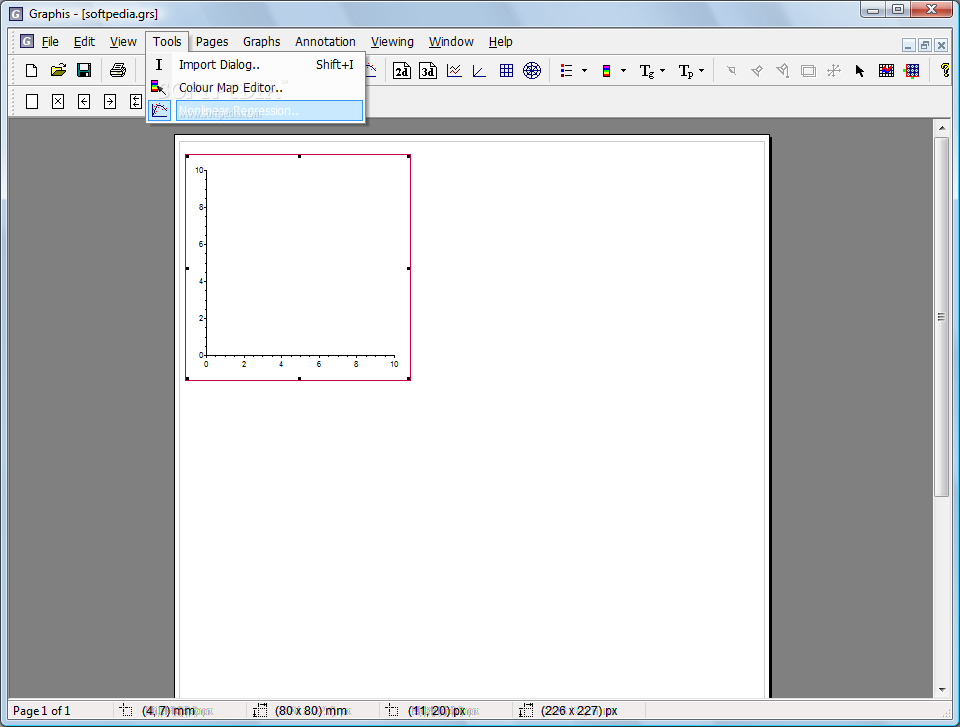
Scientific visualization software must provide robust analysis tools, and Graphis delivers with exceptional analytical capabilities. The Graphis download includes comprehensive regression functionality, featuring both standard linear regression and sophisticated multidimensional nonlinear regression tools essential for complex data analysis.
Analytical Expression Power
- VBScript Integration: Define curves using familiar mathematical syntax (e.g., y = sin(x))
- Custom Function Library: Create and load your own VBScript functions for specialized calculations
- Seamless Comparison: Plot analytical and tabular data on the same graph to evaluate models against empirical results
Customization and Presentation
- Colourmap Editor: Create custom colourmaps using RGB or HSL components beyond the built-in options
- Complete Graphical Control: Customize axis extents, divisions, labels, titles, fonts, colors, grid, walls, legends, and backgrounds
- Custom Tick Marks: Add your own ticks and labels at arbitrary positions for precise data representation
When you download Graphis for data visualization, you're investing in software that combines powerful analytical capabilities with exceptional graphical quality. Researchers across scientific disciplines rely on this visualization tool to communicate complex findings effectively through visually compelling and accurate representations.
Technical Specifications
- Platform: Windows
- Graphics Engine: OpenGL for 3D visualization
- Scripting Language: VBScript for analytical expressions
- Data Import: Character-delimited text files, direct entry, paste from clipboard
- Export Options: High-quality image outputs suitable for publication
Licensing Information
Graphis is available with a 30-day trial period, allowing users to explore its full feature set before purchase. This trial provides complete access to all visualization and analysis capabilities, making it easy to evaluate how this scientific plotting software fits into your research or engineering workflow.
Ready to transform your scientific data into powerful visual insights? Download Graphis today and experience how this professional data visualization software can enhance your analytical capabilities and help communicate your findings with greater impact and clarity.

Whether you're plotting experimental data, modeling complex systems, or preparing visuals for publication, Graphis provides the precision, flexibility, and visual quality demanded by today's scientific and engineering professionals. Start your free trial now and discover why Graphis is the preferred data visualization solution for researchers worldwide.
```
User Reviews for Graphis 8
-
for Graphis
Graphis offers a wide range of 2D plot types for data visualization and analysis. Its tabular and analytical curve creation tools are robust.
-
for Graphis
Graphis delivers astounding visuals with easy-to-learn graphing capabilities...
-
for Graphis
Graphis is an outstanding app for data visualization! The variety of 2D and 3D plot types makes it incredibly versatile.
-
for Graphis
I love using Graphis for my engineering projects. The nonlinear regression tool is a game changer!
-
for Graphis
Graphis has transformed how I analyze data. The ability to import from Excel is super convenient!
-
for Graphis
This app is fantastic! The high-quality OpenGL graphics enhance my presentations significantly.
-
for Graphis
Graphis offers full control over graphical elements, making it easy to create professional-looking plots!