
Description
IBM Visual Table Analyzer
IBM Visual Table Analyzer is a great tool if you’re constantly working with spreadsheets and trying to make sense of all that data. Whether you’re looking for patterns in sales figures, financial reports, or even tracking your favorite sports outcomes, this software has got your back!
Understanding Your Data
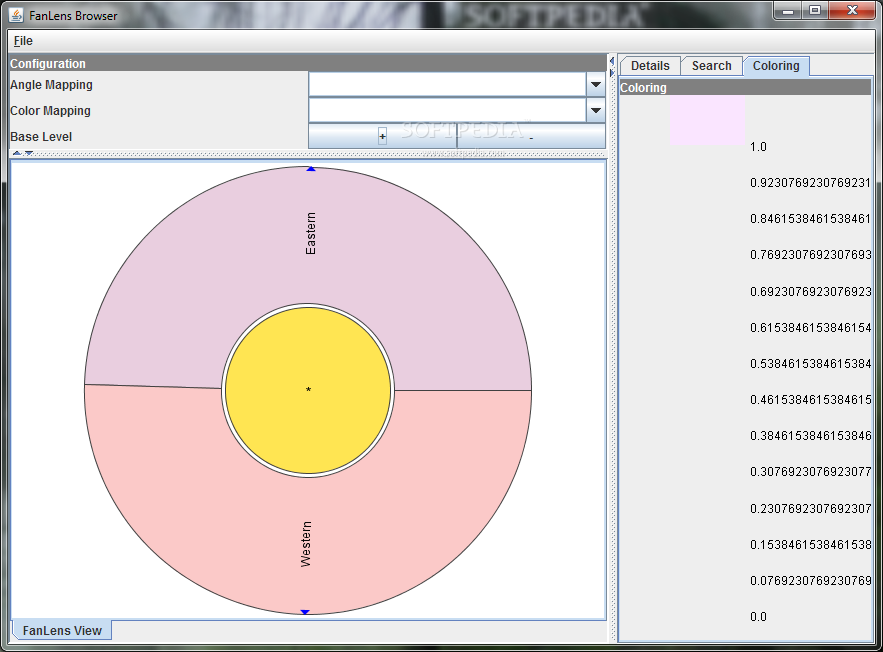
This awesome data visualization technology brings something new to the table called FanLens. This feature helps you visualize the distribution of your data in a way that’s super easy to understand. Imagine being able to see how different numbers stack up against each other using a tree-based view!
Easy Navigation and Interaction
One of the best parts? Users can easily switch between summary views and detailed views of their datasets. This means you can spot underlying patterns and relationships without getting lost in a sea of numbers.
Flexibility in Data Manipulation
The tool offers flexible options for manipulating your data. You can create your own data categories, which makes analyzing the information even easier! If you want to dig deeper into what the numbers are telling you, this feature is a game changer.
Diving Deep into Your Datasets
With IBM Visual Table Analyzer, loading and analyzing datasets is straightforward. You can dive deep into your data without any hassle, making it perfect for anyone who needs clarity from complex information.
User Reviews for IBM Visual Table Analyzer 1
-
for IBM Visual Table Analyzer
IBM Visual Table Analyzer is a powerful tool for visualizing data patterns and relationships. It offers efficient navigation and flexible data manipulation.