

Description
NTP Plotter
NTP Plotter is a handy software tool made to help you quickly create offset, frequency error, and jitter graphs from NTPD loopstat files. It's super easy to use!
Why Use NTP Plotter?
This cool application was developed because there was a real need to visualize the performance data recorded by NTPD in those loopstats files. It makes things simpler for users who want to see how their timekeeping is working.
Understanding Jitter Graphs
The jitter graph displays an extra averaged parameter in a detailed way, which helps spot small changes easily. These little changes can be crucial, like when the system switches from user-mode to kernel-mode.
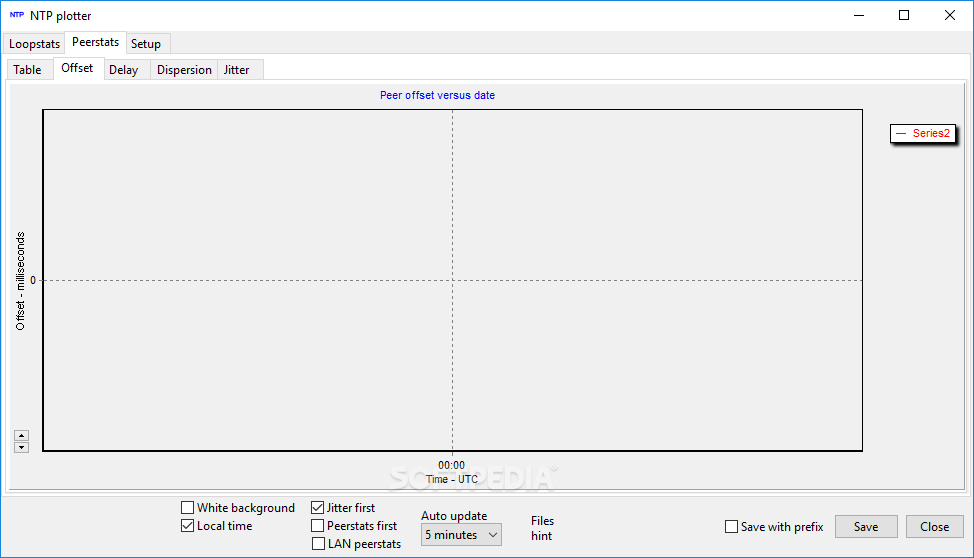
Offset Plot Insights
The offset plot shows the RMS offset variation per hour so that you can compare it with the mean offset level. Just a heads up: since NTP keeps its current loopstats files open while generating them, NTP Plotter might not show data from today.
User-Friendly Features
This application works great with command-line arguments too! You can point it to a folder containing peerstats or loopstats files, or even just one file at a time. Want to pack several of these files? No problem! Just drop them into a ZIP archive and let NTP Plotter handle it. Plus, you can drag and drop your files right into the main window using Windows Explorer for even more convenience.
Get Started Today!
If you're ready to improve your timekeeping analysis, check out NTP Plotter. It's straightforward and will make your life easier when dealing with those tricky loopstat files!
User Reviews for NTP Plotter 1
-
for NTP Plotter
NTP Plotter simplifies NTPD data analysis by generating offset, frequency error, and jitter graphs efficiently. Great tool for quick insights.