

Description
NTP Plotter
NTP Plotter is a handy software tool that helps you create graphs for offset, frequency error, and jitter from NTPD loopstat files. It makes this process super easy and quick!
What Is NTP Plotter?
This application was built because users needed a way to visualize the performance data recorded by NTPD in loopstats files. It’s pretty cool how it puts all that info into graphs so you can see what’s going on at a glance.
Understanding the Jitter Graph
The jitter graph shows an extra averaged parameter, which is really detailed. This helps you spot even tiny changes easily! For example, it can show when something switches from user-mode to kernel-mode.
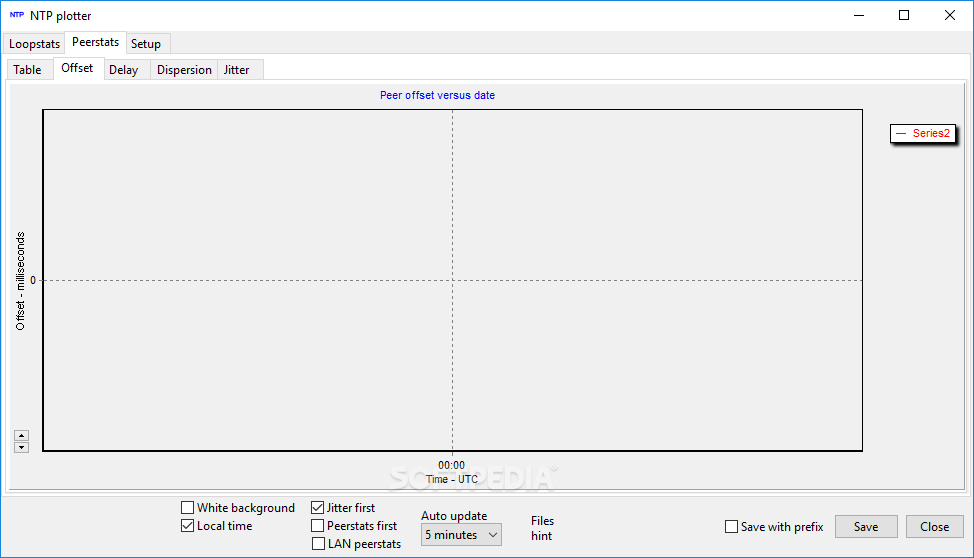
Offset Plot Insights
The offset plot gives you an estimated RMS offset variation per hour. This means you can compare it to the mean offset level, which is super helpful for understanding performance over time. Just a heads up: since NTP keeps its current loopstats files open while generating them, NTP Plotter might not show today’s data right away.
User-Friendly Features
You can use NTP Plotter with command-line arguments too! This lets you specify folders full of peerstats or loopstats files, whether it’s just one file or multiple ones packed in a ZIP archive. Plus, if you're more of a drag-and-drop person, you can easily drop those files right onto the main window in Windows Explorer.
User Reviews for NTP Plotter 1
-
for NTP Plotter
NTP Plotter provides users with detailed offset, frequency error, and jitter graphs from NTPD loopstat files. Effortlessly plot and analyze NTP data.