

Description
PanelCheck
PanelCheck is a super user-friendly tool that's all about analyzing sensory data and calculating parameters using different plot algorithms. It’s great because you can create lots of plot graphs that help visualize sensory profiling data. Plus, it gives you insights into both the assessors and panel performance.
Importing Your Data Easily
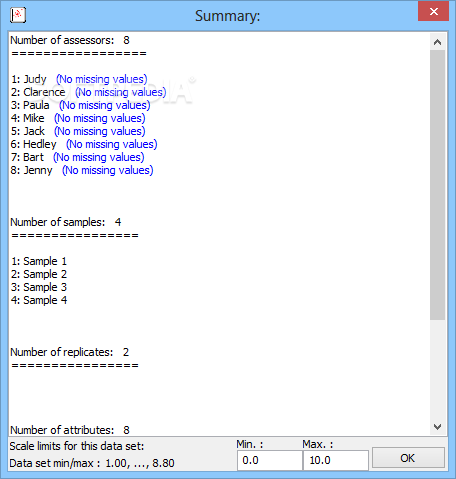
Now, here's the thing: PanelCheck only works with data that you import from an external file. So, it doesn’t have an editor for changing values directly in the app. But don’t worry! You can easily bring in data from text files or Excel spreadsheets—just make sure they are tab, comma, or semicolon delimited files. Oh, and you'll need Microsoft Excel to import those spreadsheets.
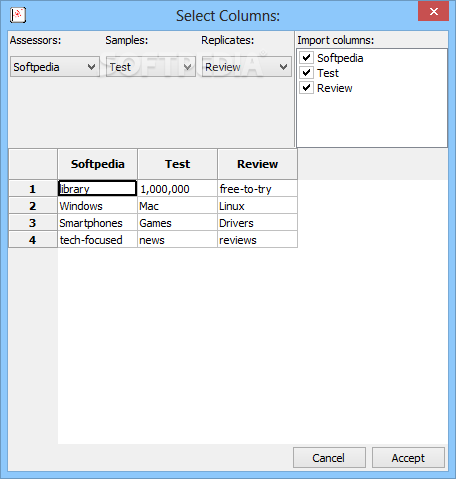
Mapping Your Data Columns
Once you’ve got your file imported, you’ll want to map those columns to match up with the parameters you need. For the algorithms to work their magic, you'll need three variables: assessors, samples, and replicates. You get to pick which columns from your file represent these parameters!
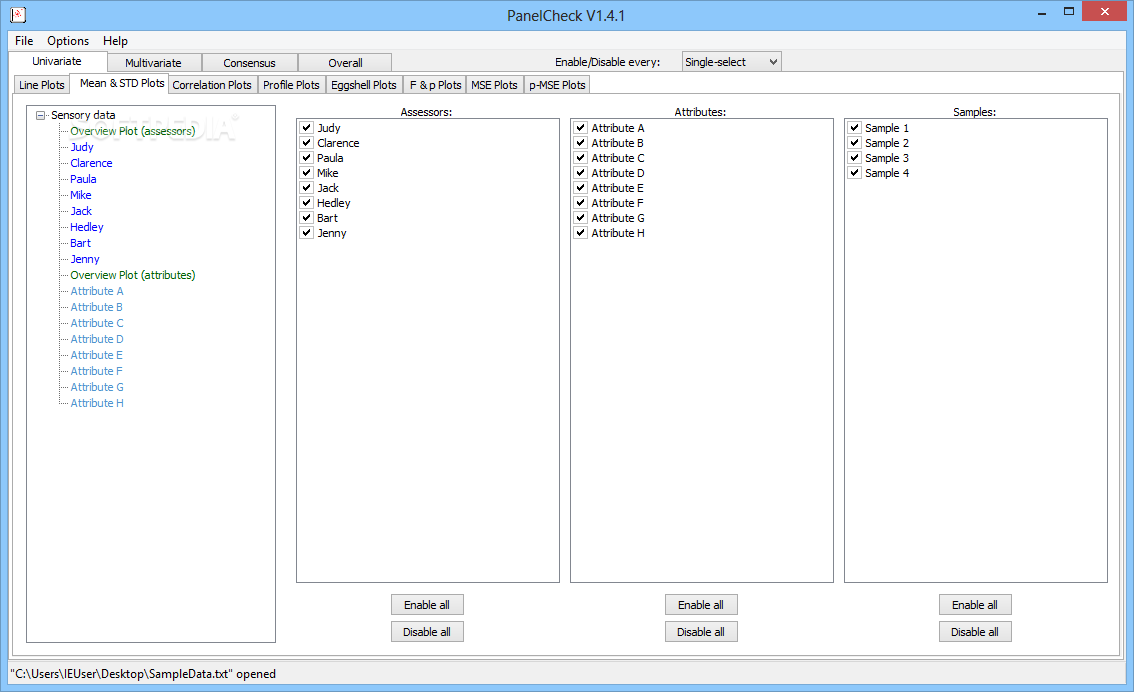
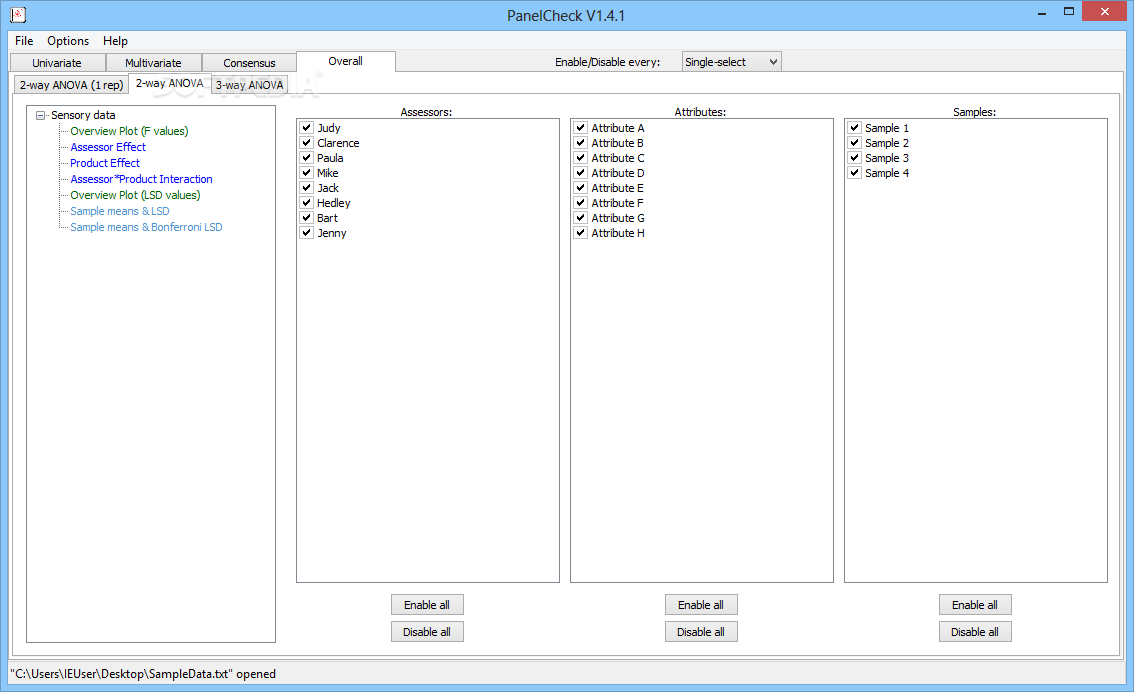
Generating Plots in a Snap
After you've analyzed your imported data, PanelCheck can whip up plots instantly! Just click on an entry in the sensory data list to access them. You'll see columns for assessor, attribute, and sample values right there for easy viewing and filtering. Need to include or exclude any values from the plot? One simple click does it!
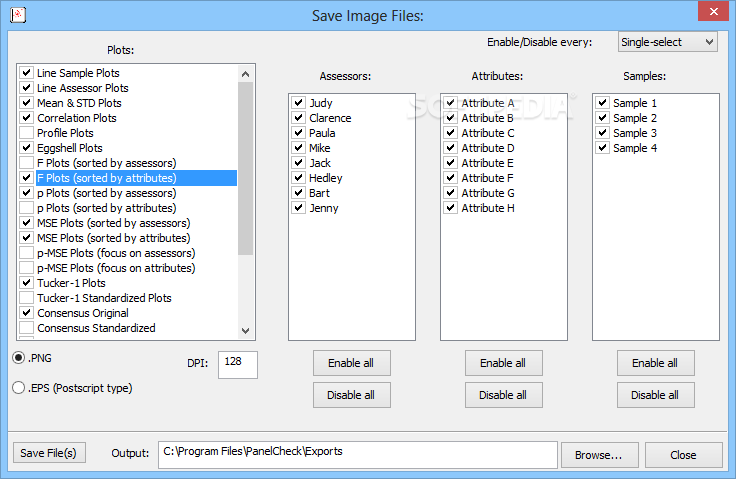
Diverse Plot Options
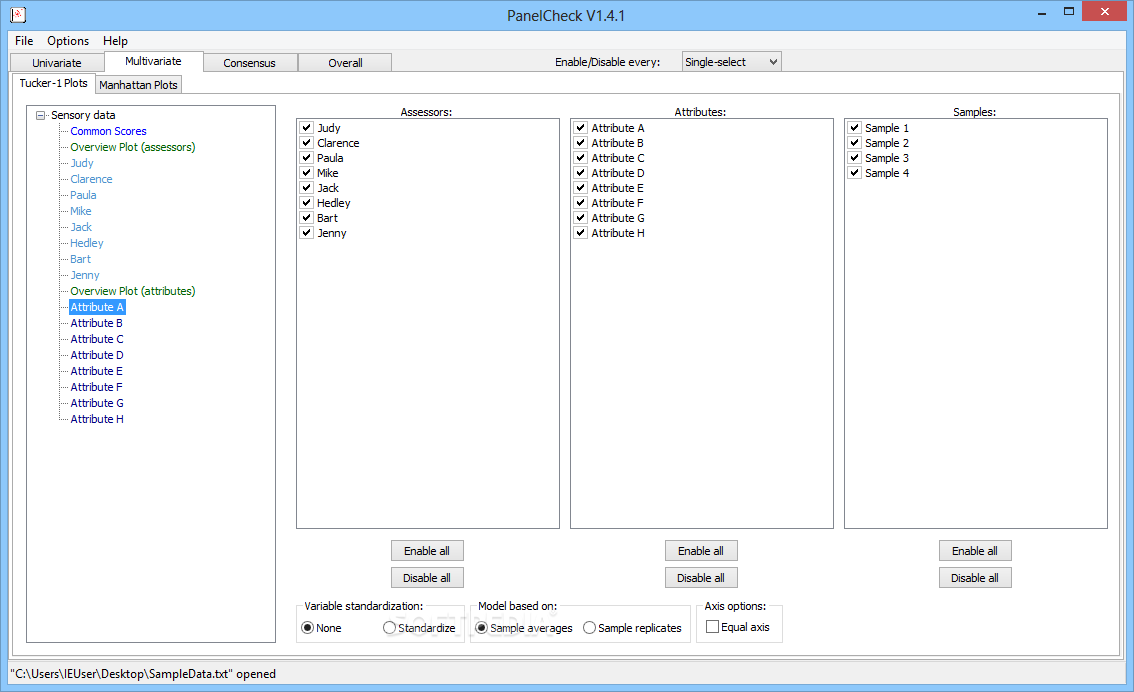
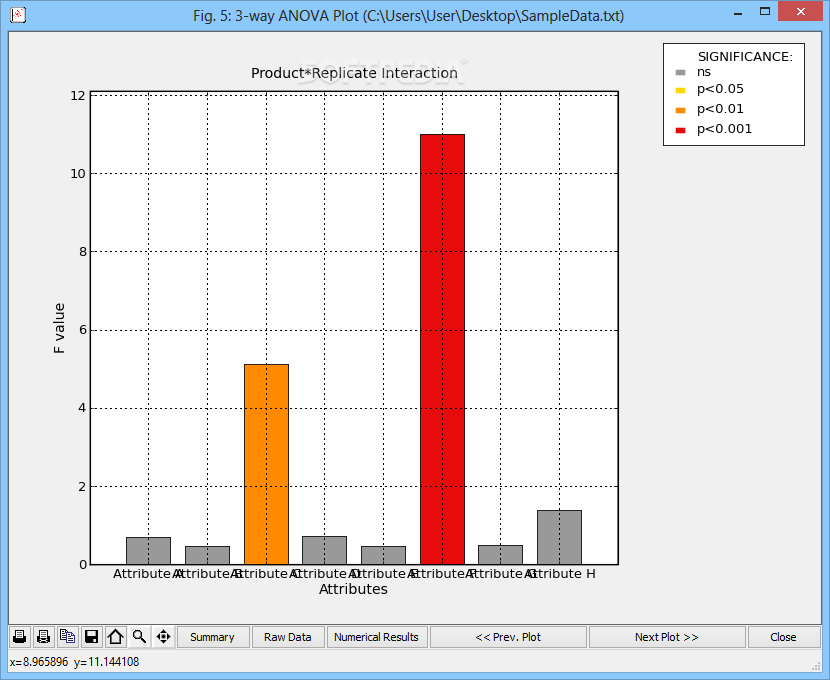
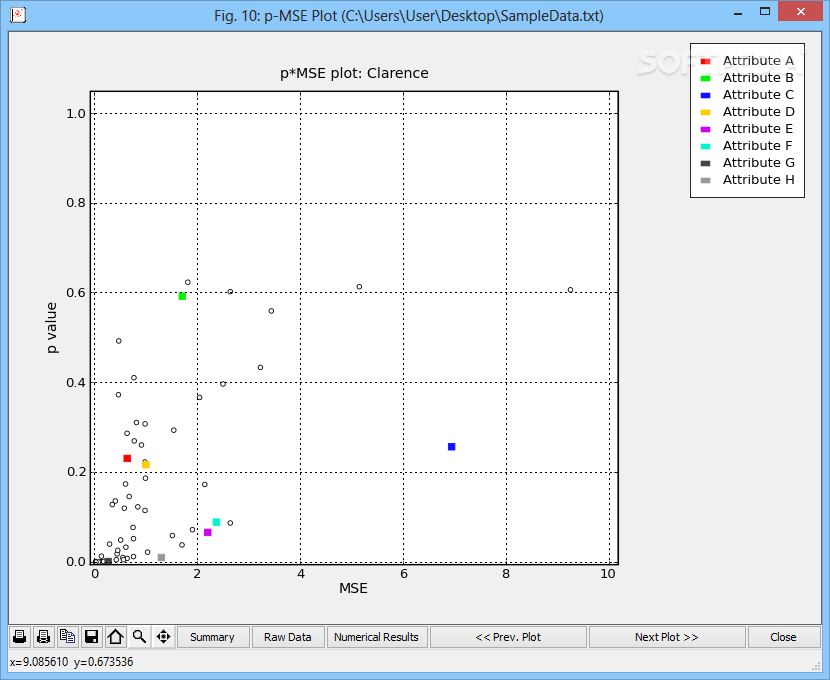
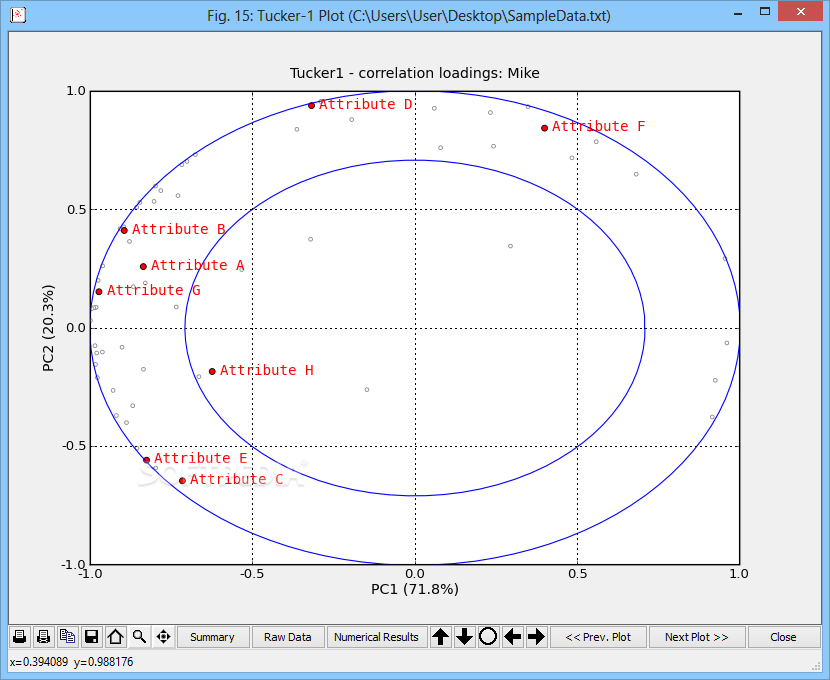
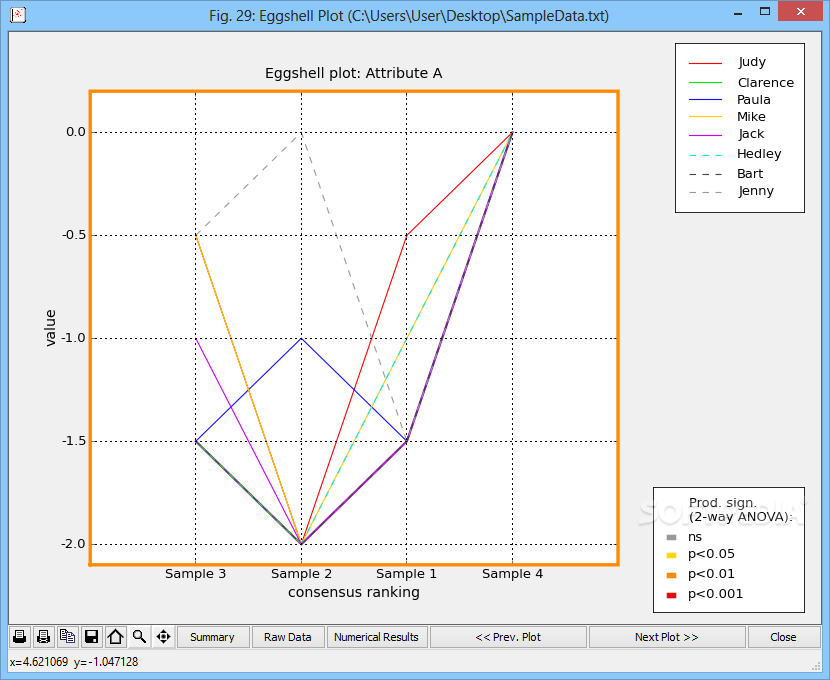
This program is pretty versatile—it can generate line plots, correlations, profile graphs, eggshell plots, F&P graphs, MSE and p-MSE graphs in Univariate mode. If you're looking at Multivariate mode instead? You can view Tucker-1 and Manhattan plots too! Plus, check out Standardized or STATIS tables from the Consensus tab. And don’t forget about those statistic graphs generated by ANOVA methods found in the Overall section.
A Reliable Analysis Tool
If you're dealing with a ton of data, PanelCheck has got your back! It's reliable for data analysis and generating plots while handling large amounts of information like a pro. The tool applies variable standardization and creates graphs based on sample averages or replicates as needed. And yes—there are several ANOVA methods available so you can identify general trends across all entries.
User Reviews for PanelCheck 7
-
for PanelCheck
PanelCheck offers a seamless experience for analyzing sensory data and generating various plot graphs. Ideal for visualizing sensory profiling data.
-
for PanelCheck
PanelCheck is an incredible tool for sensory data analysis! The ease of importing data and generating plots is fantastic.
-
for PanelCheck
I love how simple PanelCheck makes analyzing sensory data. The variety of plots it generates are incredibly helpful!
-
for PanelCheck
PanelCheck has transformed the way I analyze sensory profiles. It's intuitive and powerful for handling large datasets.
-
for PanelCheck
This app is a game changer! The ability to visualize sensory data with just a few clicks saves so much time.
-
for PanelCheck
PanelCheck is essential for any sensory analysis work. It provides clear insights through its various plotting options!
-
for PanelCheck
Absolutely love PanelCheck! It’s user-friendly, efficient, and delivers precise statistical outputs every time.