
Description
SPC for Excel
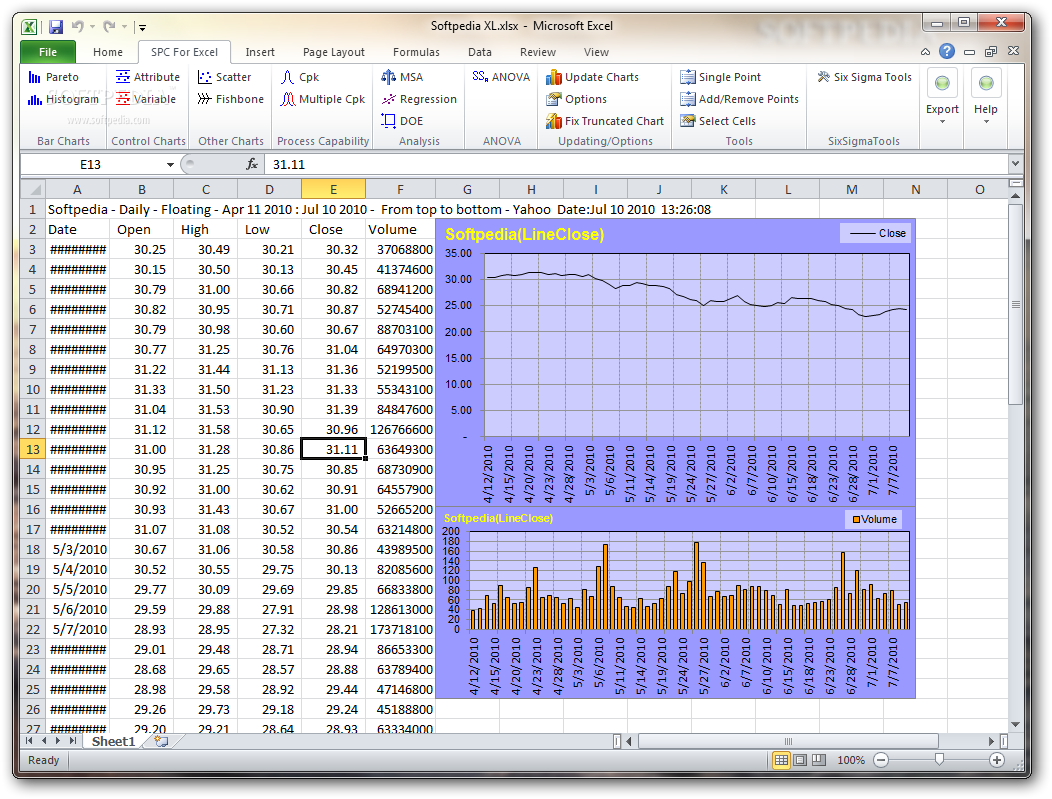
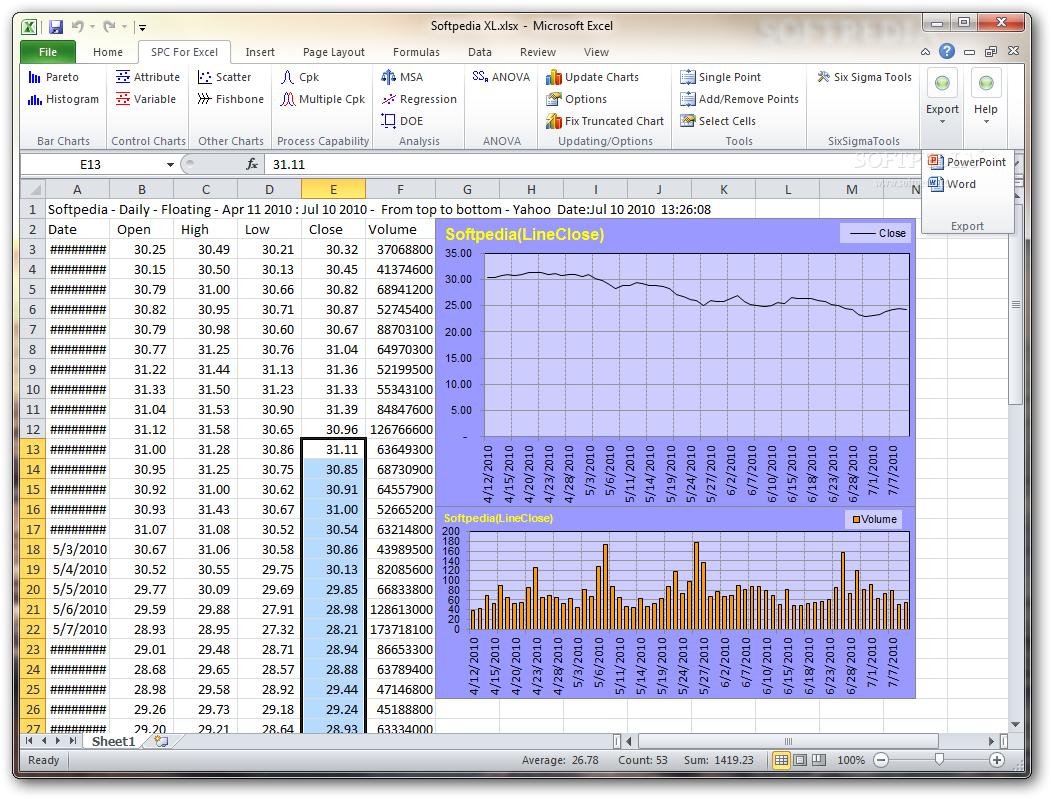
SPC for Excel is a cool add-on that works right inside Microsoft Excel. It makes looking at data way easier by letting you do some neat statistical analysis. You can whip up charts using the numbers in your spreadsheet and even tweak them to add more useful info.
Statistical Tools at Your Fingertips
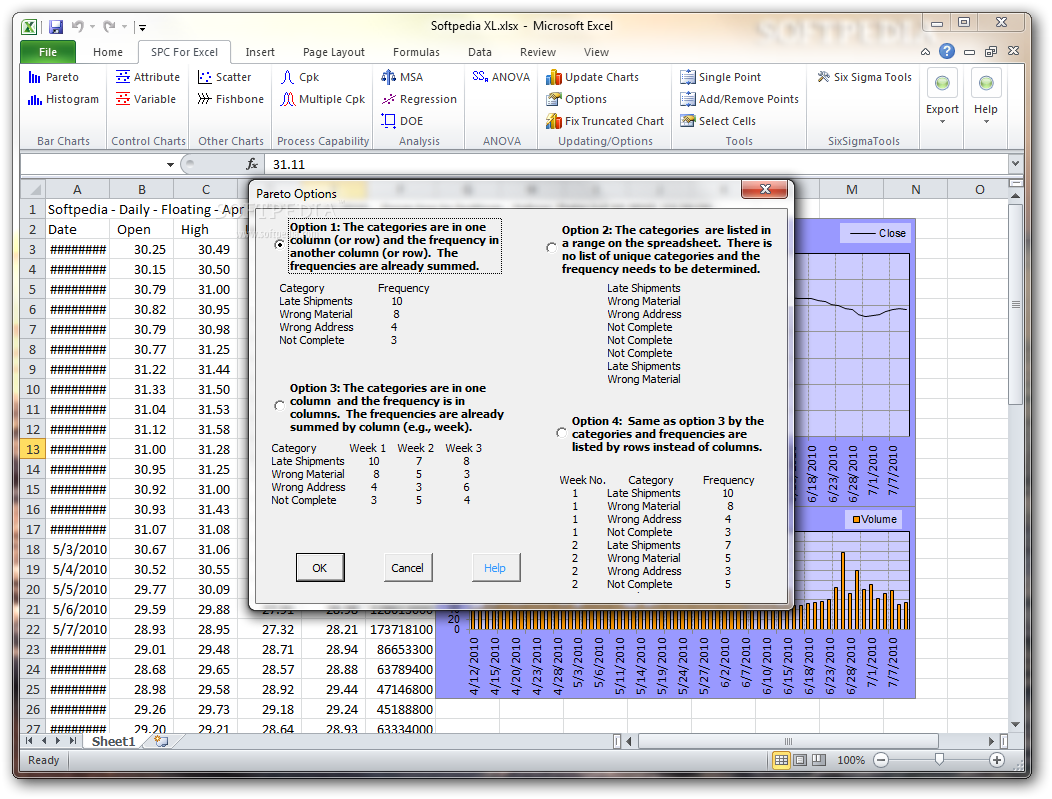
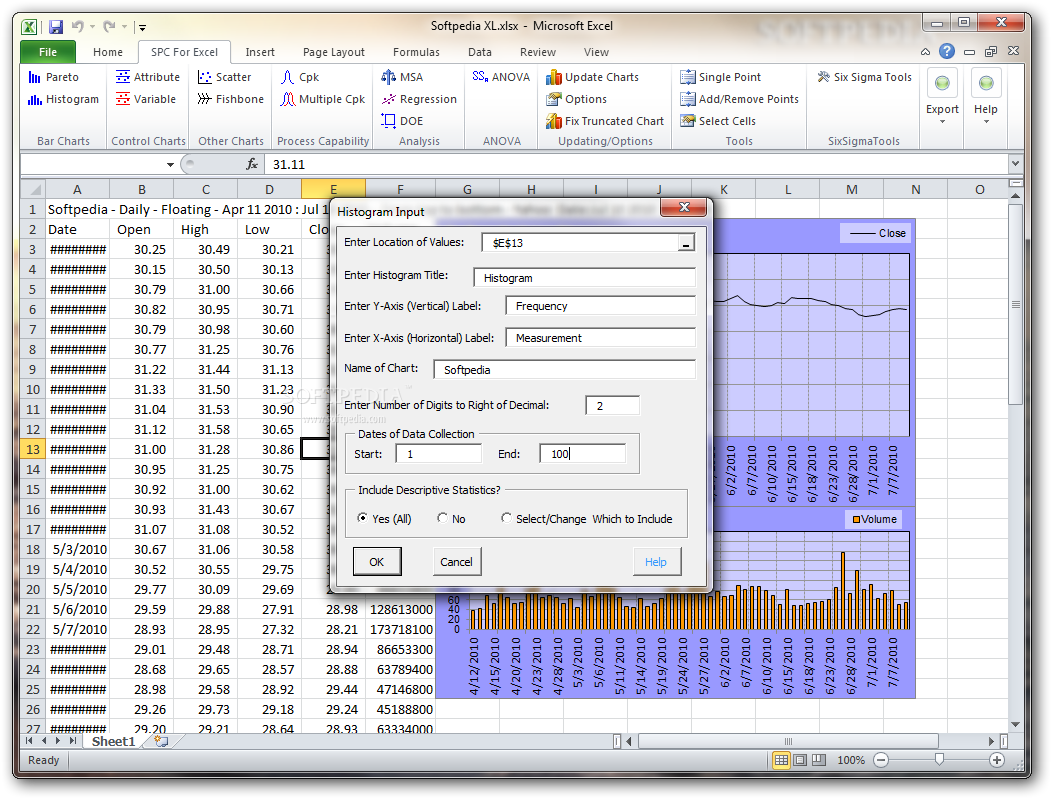
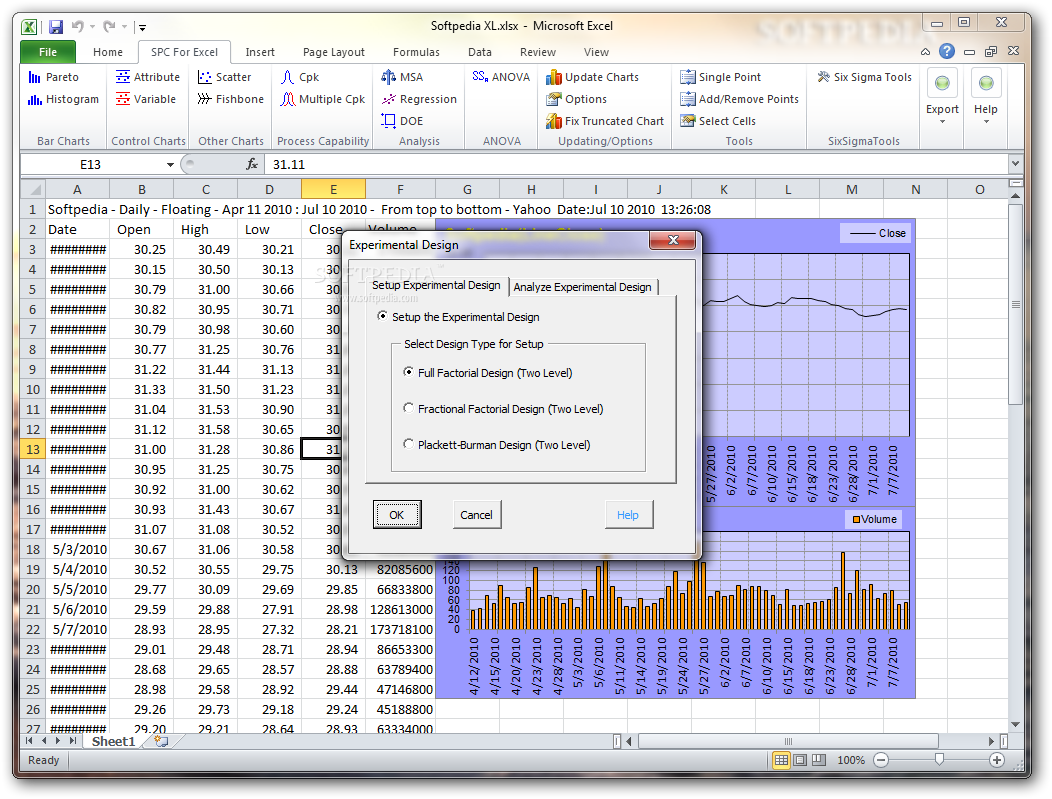
This extension comes packed with tons of statistical tools and techniques. Want to make a Pareto diagram? No problem! You can also update any existing diagrams you have. Plus, it lets you create histograms, variable and attribute control charts, and even cause-and-effect diagrams.
Easy Access to Features
The add-on menu has everything you need to turn your data into stunning statistical visuals right in Excel. It's super user-friendly! You can easily control the values and info in your charts and diagrams with options that help you update the details or even enrich them with new data.
Identifying Changes Made Simple
This tool offers multiple ways to spot important changes in process means, like Fisher's LSD, Tukey's test, and Bonferroni's method. With these methods, you'll know about different treatment means or variances at a glance.
A Useful Tool for Everyone
The flexibility of this add-on combined with its vast array of statistical tools makes it perfect for all sorts of organizations. Whether you're working in quality assurance or engineering, this software is sure to come in handy!
User Reviews for SPC for Excel 1
-
for SPC for Excel
SPC for Excel simplifies statistical analysis in Excel, offering a wide range of tools for creating charts and diagrams. Useful for organizations and engineers.