Description
Ishikawa Diagram
Ishikawa Diagram is a super helpful tool that makes it easy to understand those tricky quality control rules. It's like having a map for problems and solutions!
What is an Ishikawa Diagram?
This diagram was created back in the 1960s by Kaoru Ishikawa to help Kawasaki improve their shipyard's quality control. Even today, it's a must-have for any quality control manager!
The Fish Bone Design
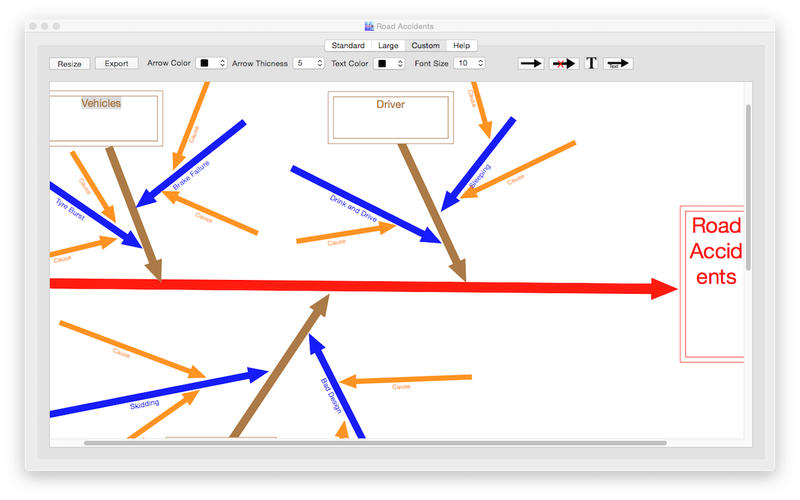
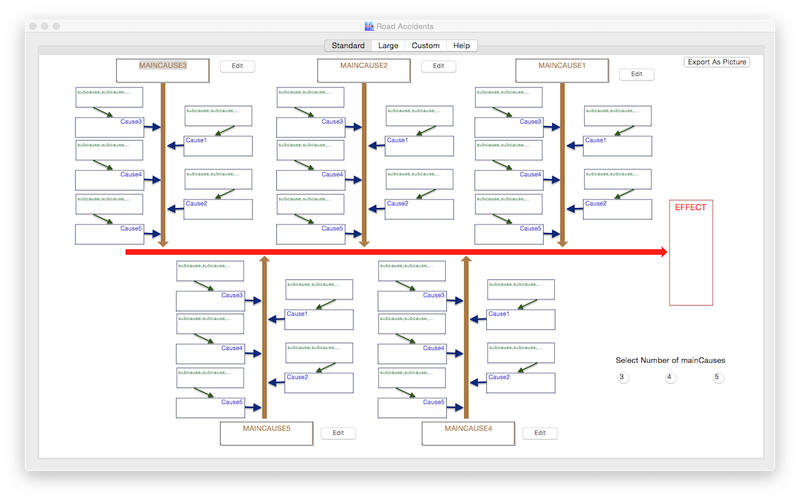
Because of its unique shape, people also call it a fish bone diagram. When you look at it, you'll see it kind of looks like a fish skeleton! Each “rib” represents different cause and effect pairs, which helps in figuring out what’s going wrong.
Easy Customization
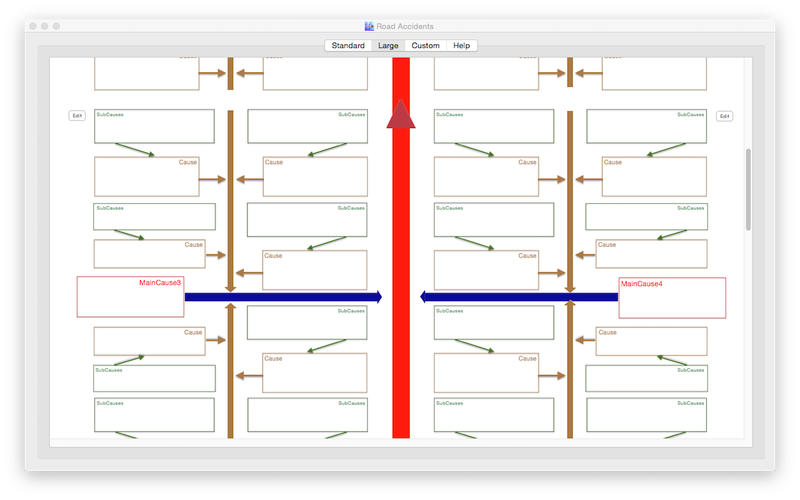
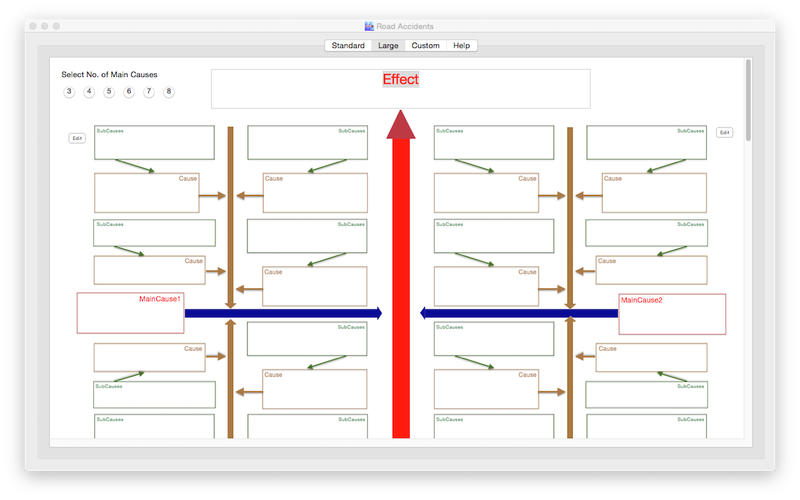
With the Ishikawa Diagram, you can easily pick how many main causes to include on your graph. Plus, you can choose how to export your diagram once you're done.
Print Your Work
If you want to print your diagram, no worries! The app works smoothly with Mac OS X's print dialog, making printing super simple.
Helpful Features
An added perk? The Ishikawa Diagram app has a Help feature that gives clear explanations about what these diagrams are all about. This means even if you're new to this kind of thing, you'll get the hang of it quickly!
No Experience Needed!
Overall, using Ishikawa Diagram is straightforward and doesn’t require any prior knowledge or experience. You can create your fish bone diagrams from scratch without breaking a sweat!
If you're ready to simplify your quality control tasks and make sense of complex issues quickly, check out the download link for Ishikawa Diagram. It's time to dive in!
User Reviews for Ishikawa Diagram FOR MAC 1
-
for Ishikawa Diagram FOR MAC
Ishikawa Diagram for Mac simplifies complex quality control mechanisms effortlessly, making it a fundamental tool for any manager.


