
Description
Ishikawa Diagram
Ishikawa Diagram is a simple tool that can help you make sense of the complicated rules around quality control. It’s really effective for sorting out what might be causing issues in your projects.
What is an Ishikawa Diagram?
This diagram was created back in the 1960s by Kaoru Ishikawa to help Kawasaki improve its shipyard quality. Even today, it’s still a must-have tool for anyone working in quality control!
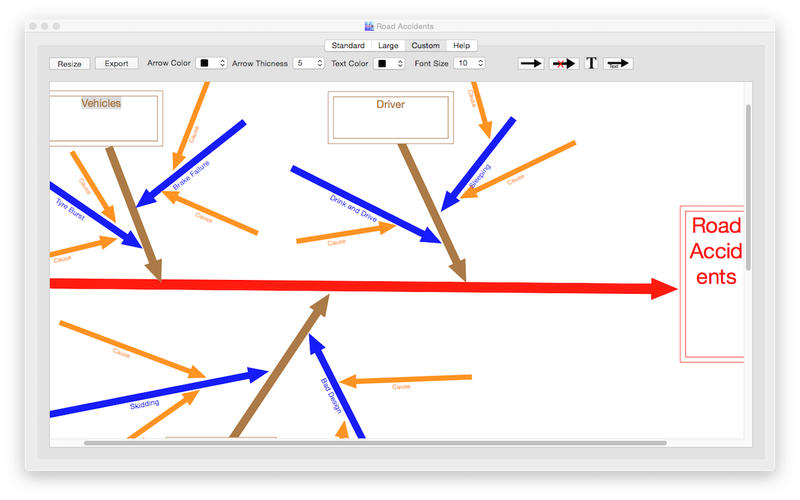
The Fish Bone Shape
You might hear people call it a fish bone diagram because of its unique shape. When you look at it, you’ll see that it looks like a fish skeleton! Each “bone” represents different causes and effects related to the problem you're looking into.
Easy to Use Features
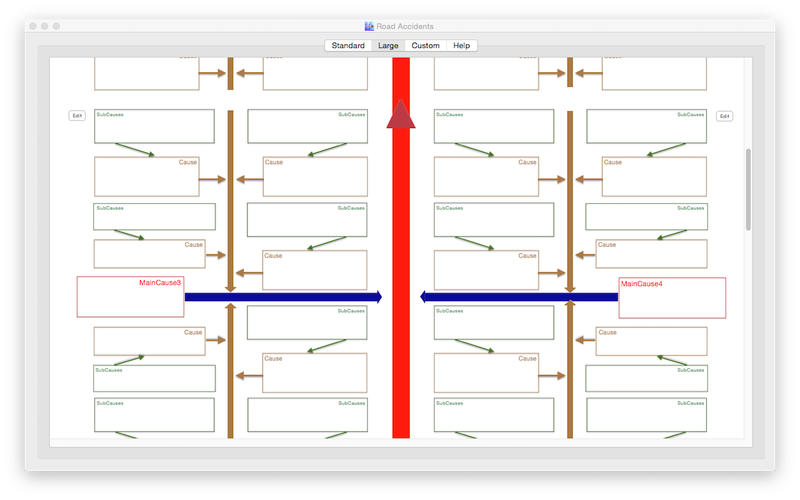
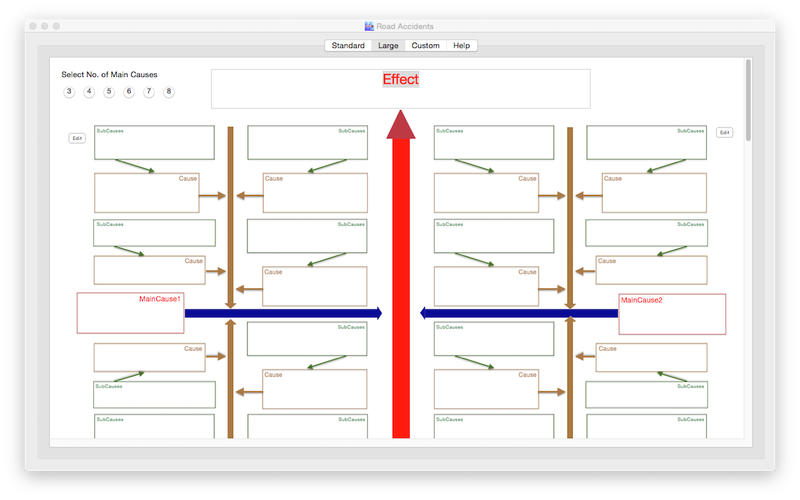
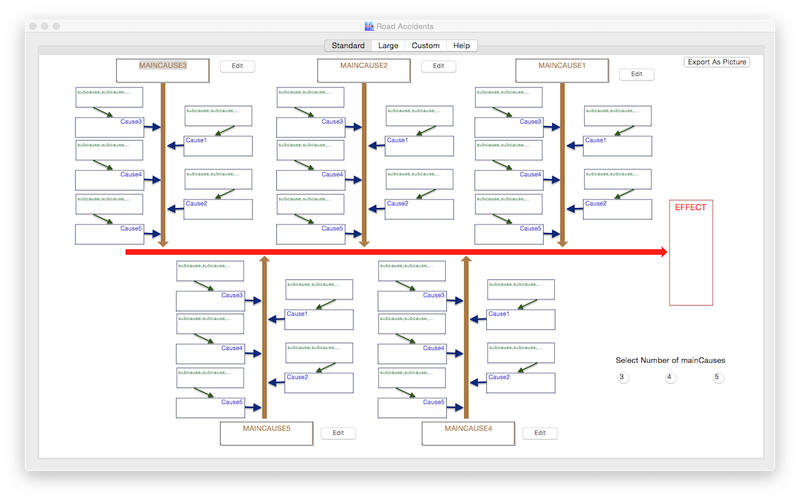
With the Ishikawa Diagram, you can easily choose how many main causes to add to your graph from the lower right side panel. Plus, it lets you decide how you want to export your finished diagram!
Printing Made Simple
You can also quickly print out your designed diagram using Mac OS X's built-in print dialog. It makes sharing your work super easy!
Helpful Help Feature
If you're new to this, don’t worry! The Ishikawa Diagram app has a Help feature that gives clear explanations about what an Ishikawa diagram is and what principles to follow before creating your own.
No Experience Needed!
Overall, the Ishikawa Diagram gives users an easy way to create fish bone diagrams from scratch. You don’t need any prior knowledge or experience—just dive in and start designing!
If you're ready to get started with this awesome software, check out the download page for more info: Ishikawa Diagram Download.
User Reviews for Ishikawa Diagram FOR MAC 1
-
for Ishikawa Diagram FOR MAC
Ishikawa Diagram FOR MAC is a user-friendly tool for creating fish bone diagrams, perfect for quality control managers. Helpful features and simplicity make it recommendable.