
Description
JProfiler Portable - Analyze and Resolve Java Performance Issues
Are you a Java programmer looking to optimize your application's performance? Look no further than JProfiler Portable, a powerful tool designed to help you analyze JVM tools, troubleshoot bottlenecks, and resolve memory leaks. This resourceful application offers a clean working environment with support for third-party integrations and Java Enterprise Edition.
Key Features:
- Analyze JVM tools and troubleshoot bottlenecks
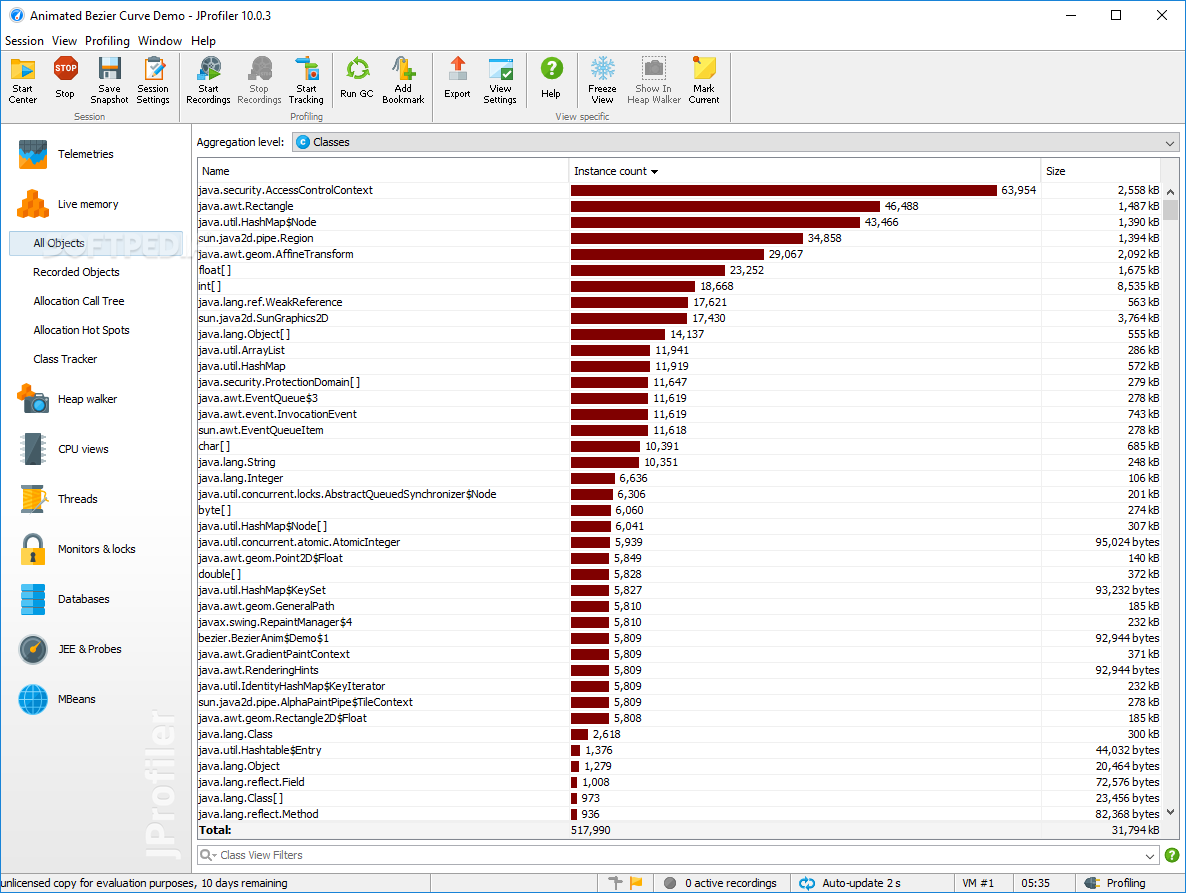
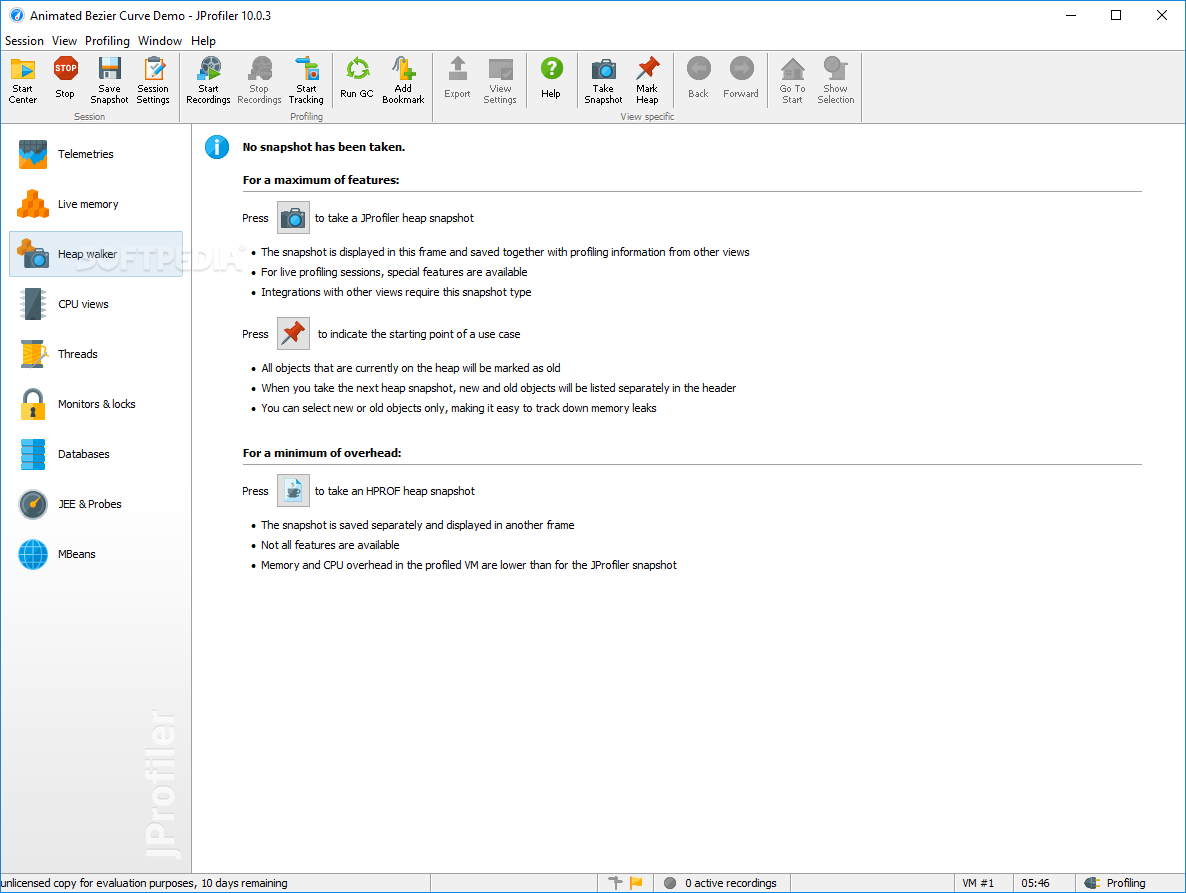
- Resolve memory leaks efficiently
- Support for Java Enterprise Edition
- JDBC and JPA/Hibernate probes for fixing database calls
- NoSQL probes for MongoDB, Cassandra, and HBase for handling database access errors
- Attach to JVMs (local or remote) and profile application servers
- Save ongoing projects as snapshots for later analysis
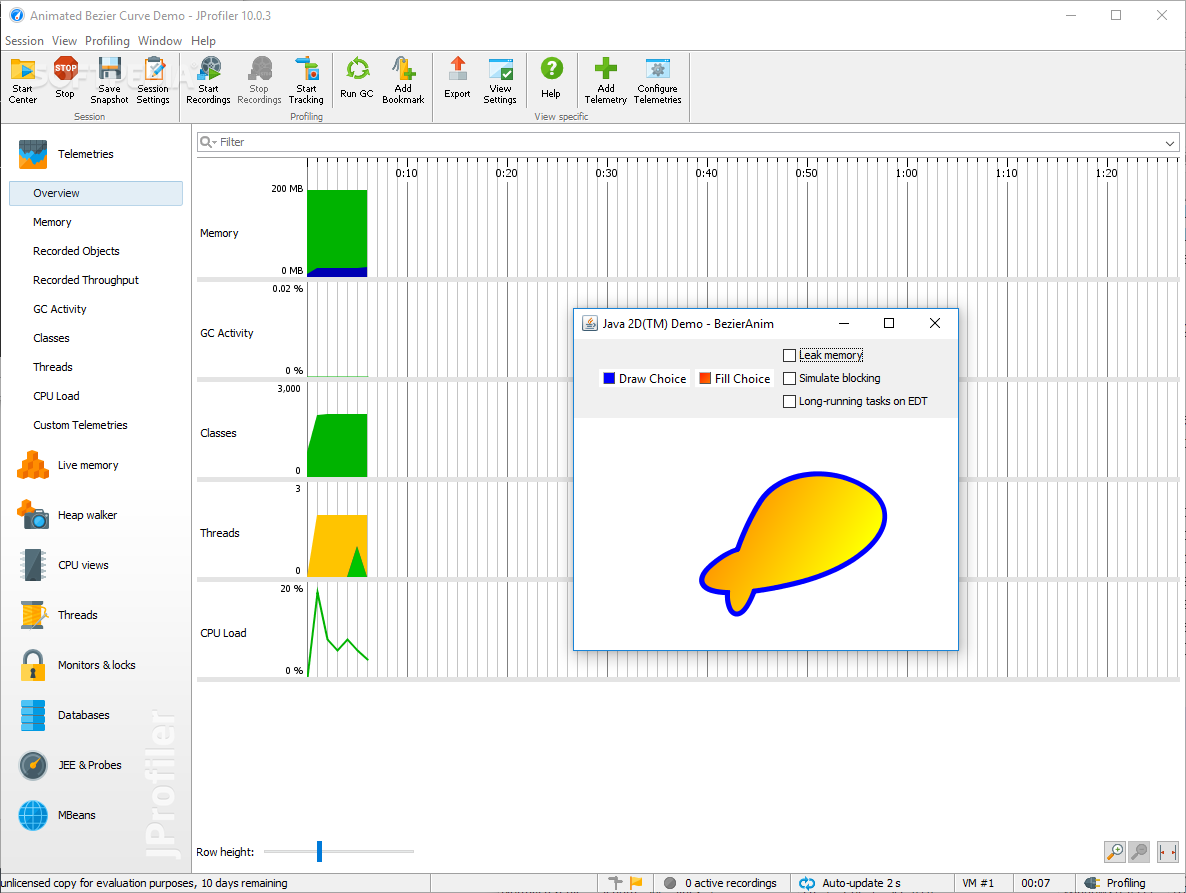
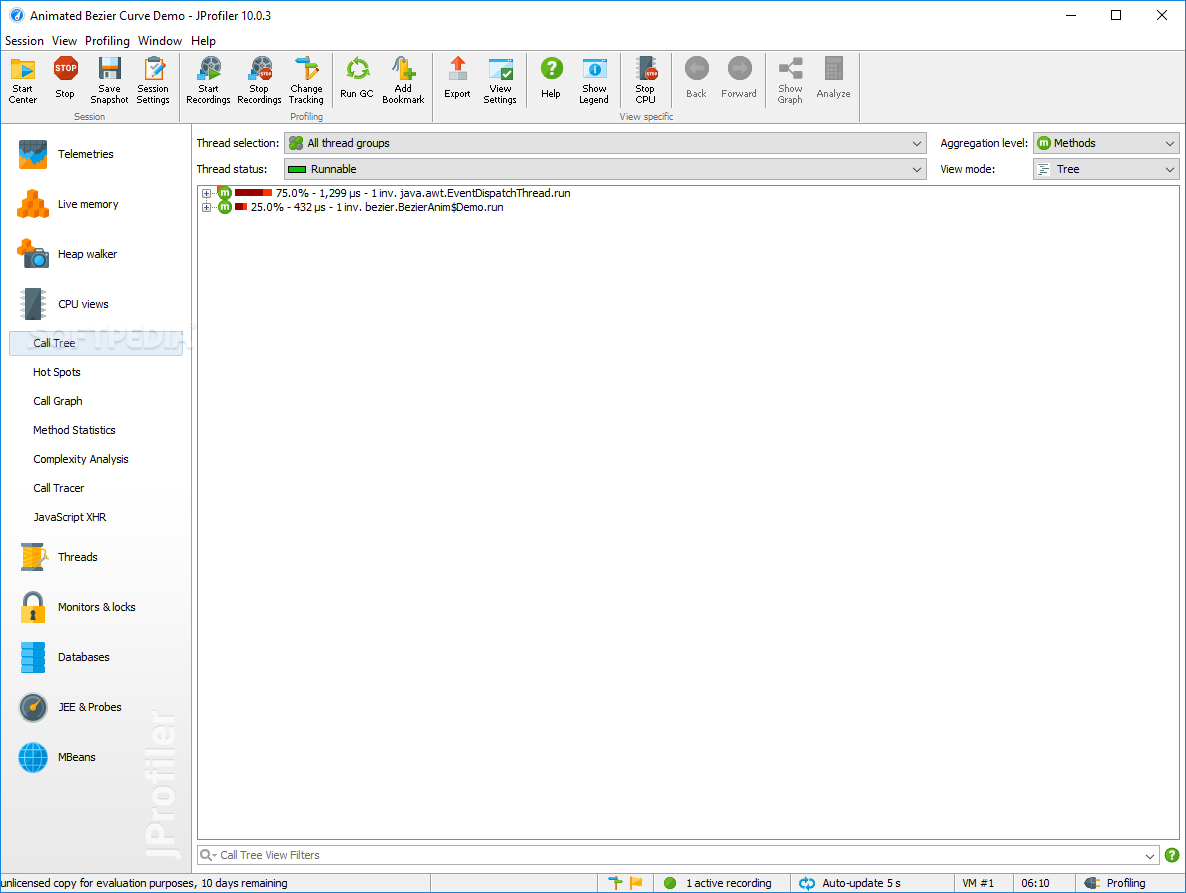
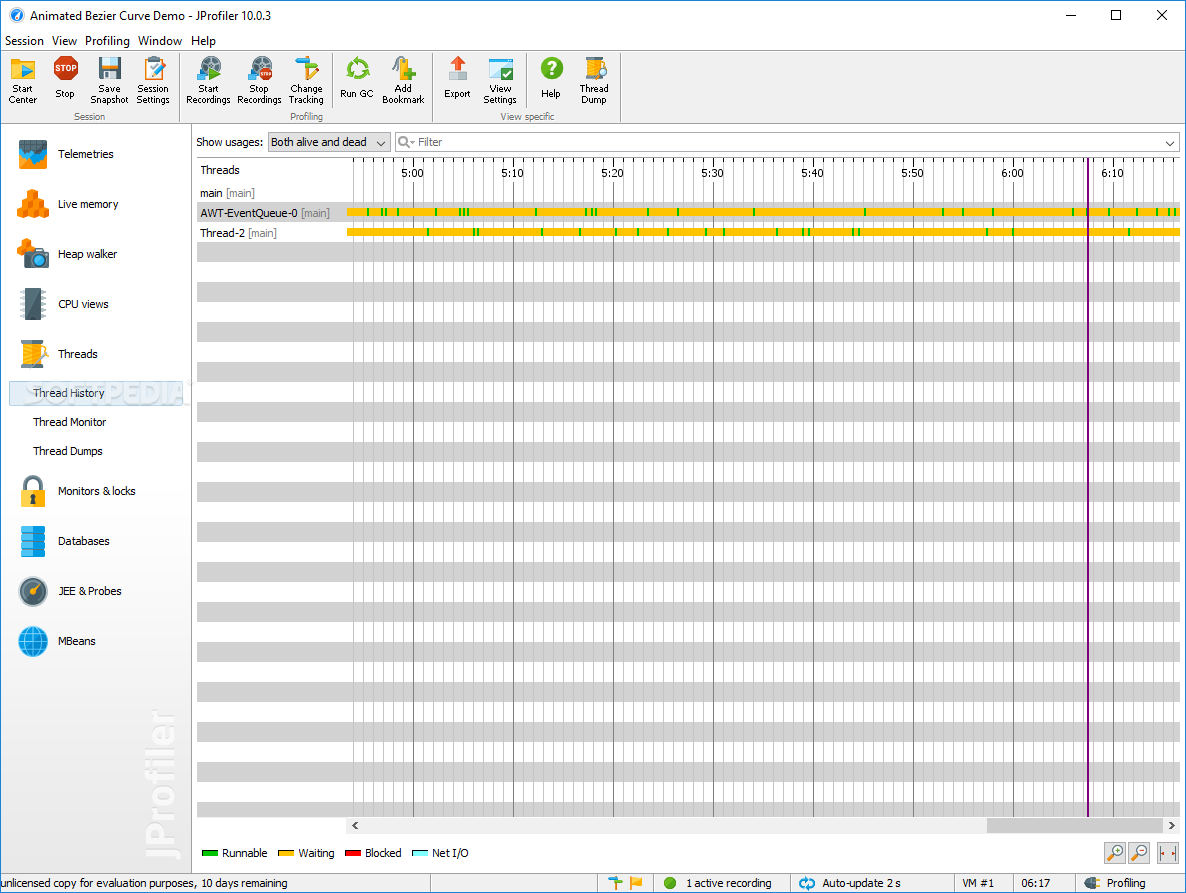
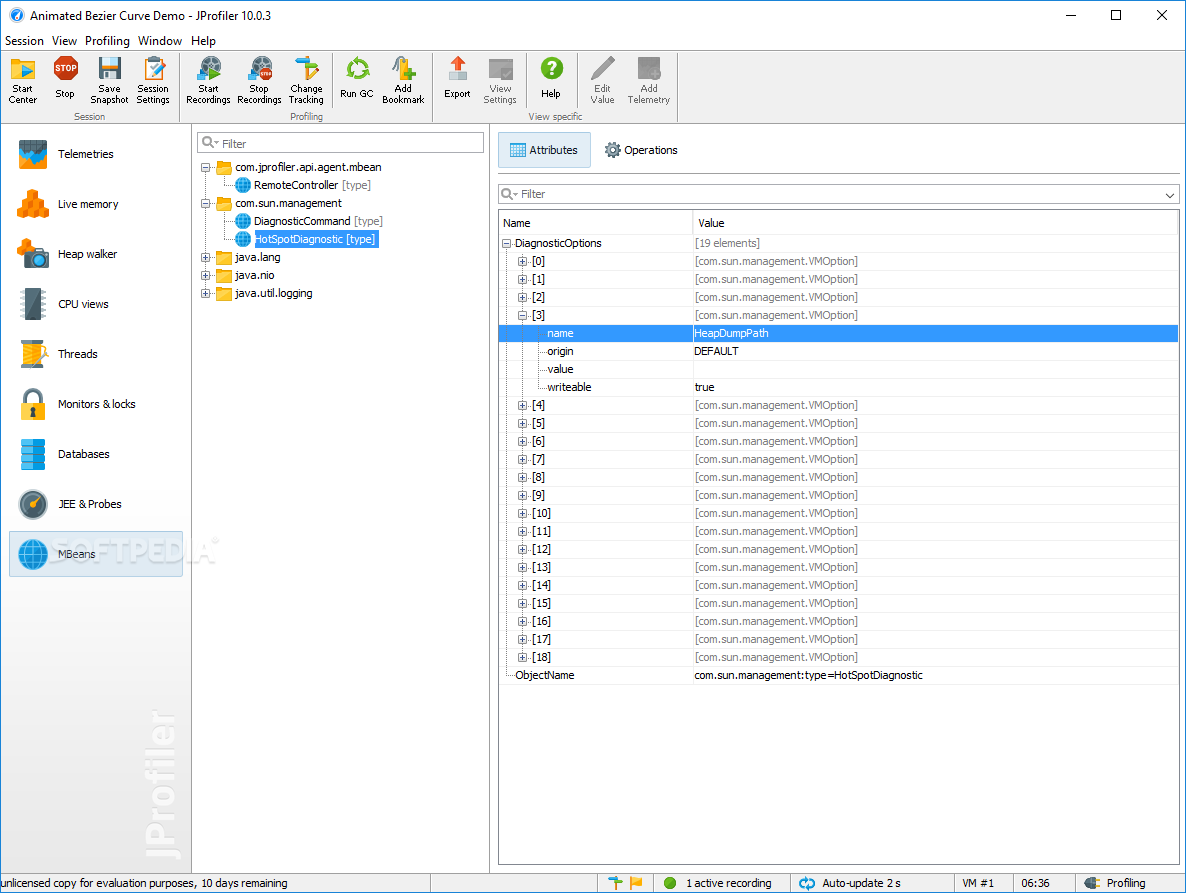
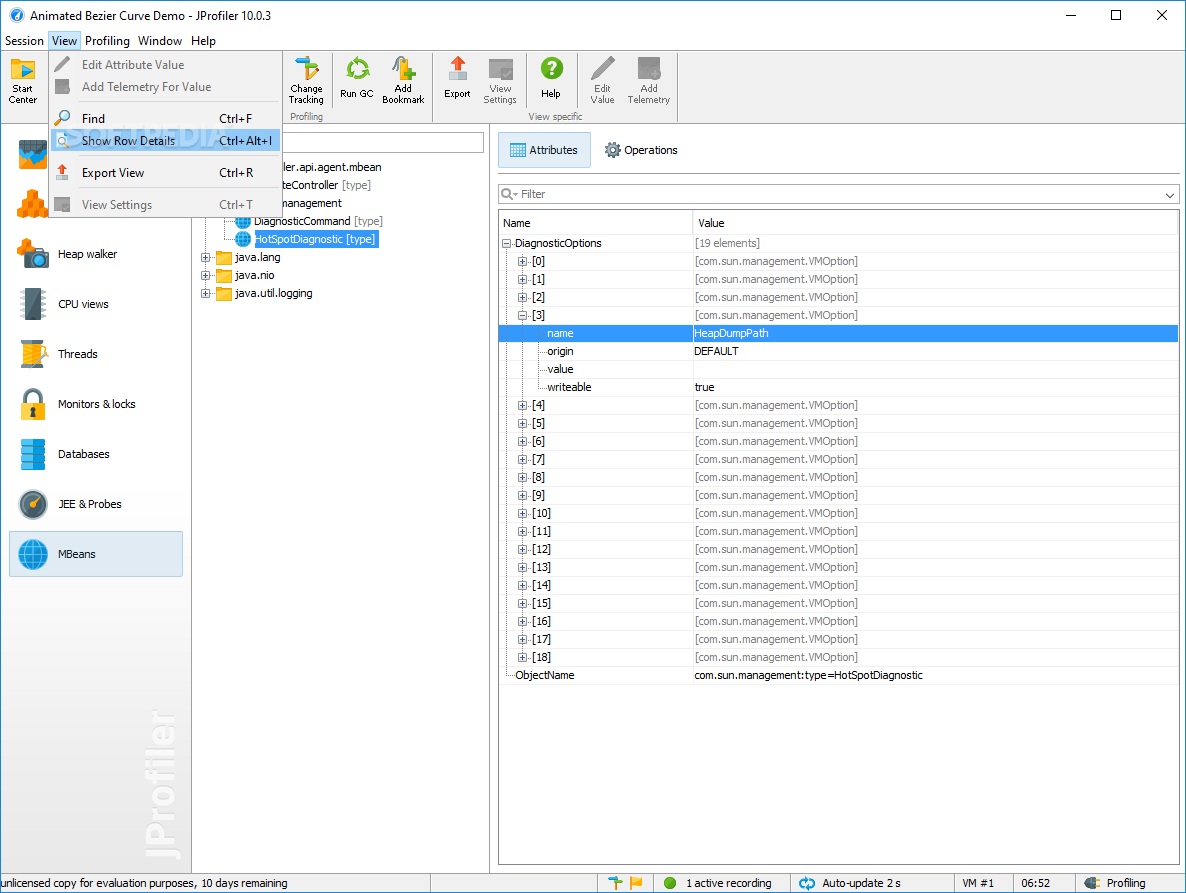
Organized Layout for Easy Navigation
The main app window of JProfiler Portable features a neatly organized layout where you can access telemetries, live memory data, CPU views, threads, monitors and locks, databases, JRR and probes, and MBeans folders separately. This allows for quick and easy navigation while analyzing your Java application.
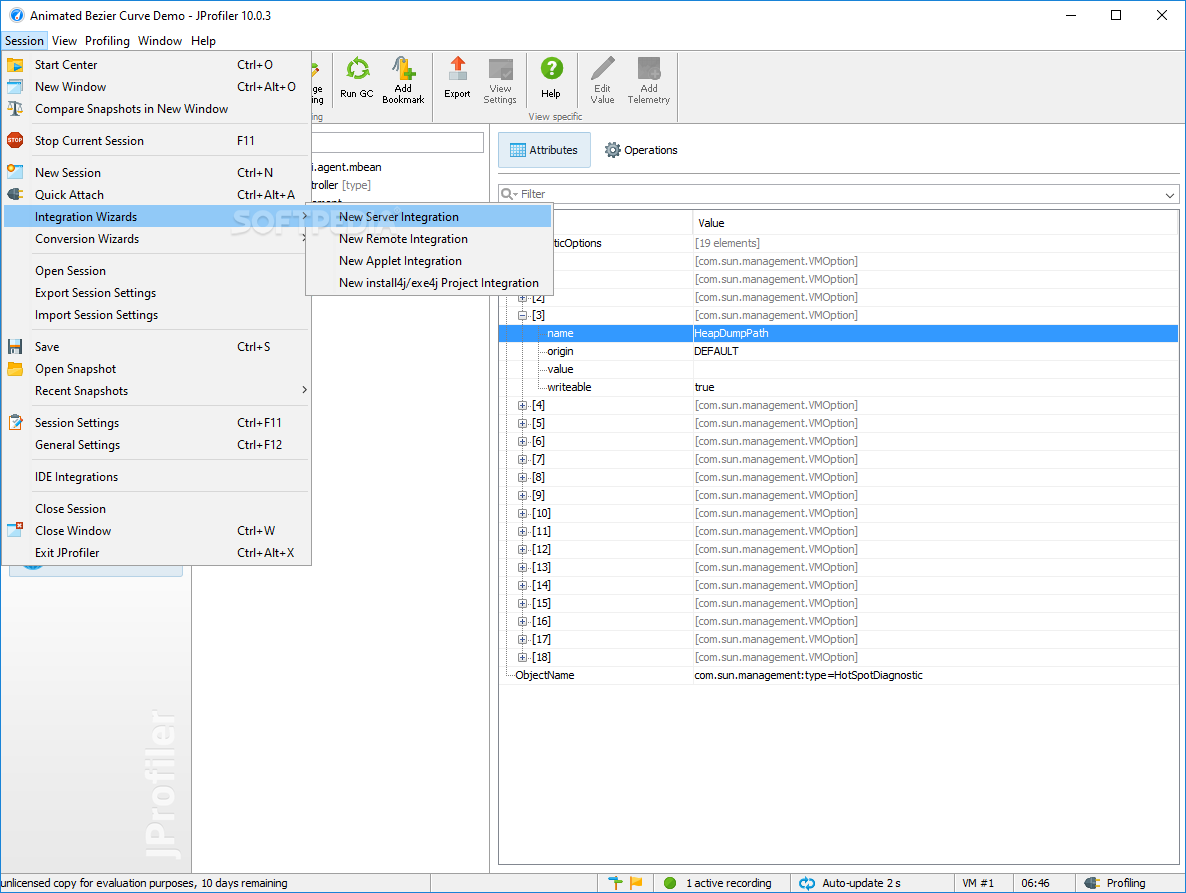
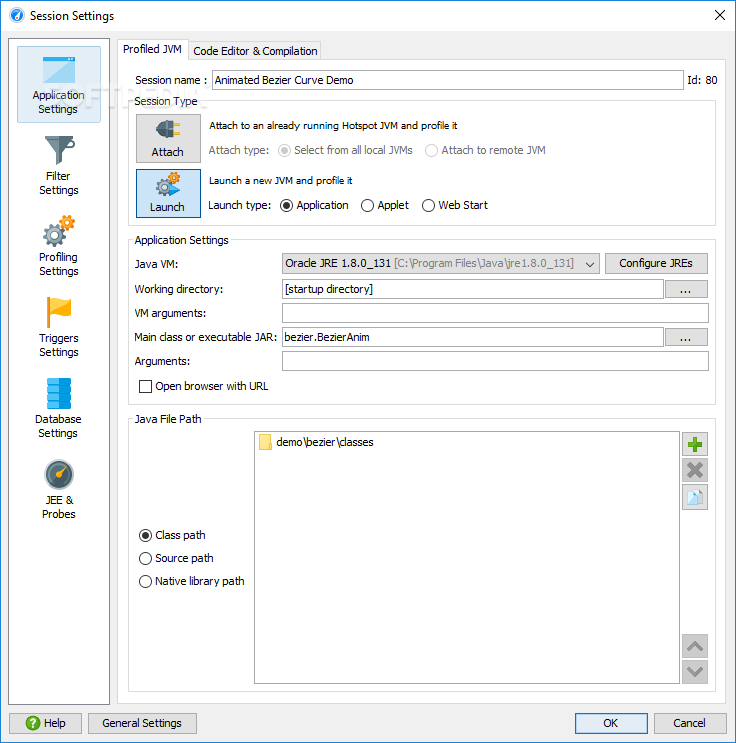
Integration Wizards for Seamless Setup
Integration wizards in JProfiler Portable enable you to set up new servers, remote connections, applets, install4j or exe4j projects effortlessly. You can also convert application sessions to remote, offline, or redistributed sessions with ease. The tool supports integration with popular IDEs such as IntelliJ IDEA, Eclipse, NetBeans, and Oracle Developer.
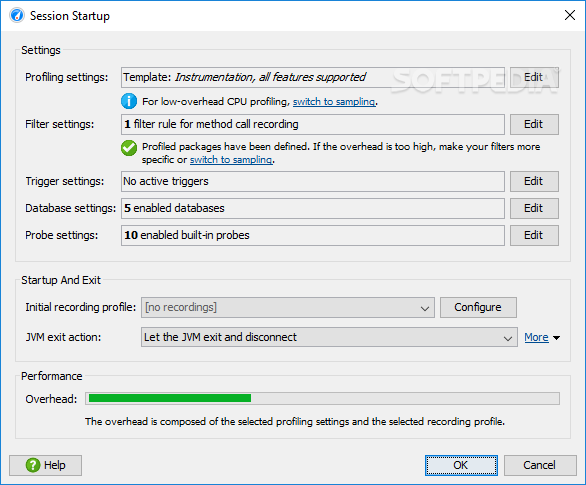
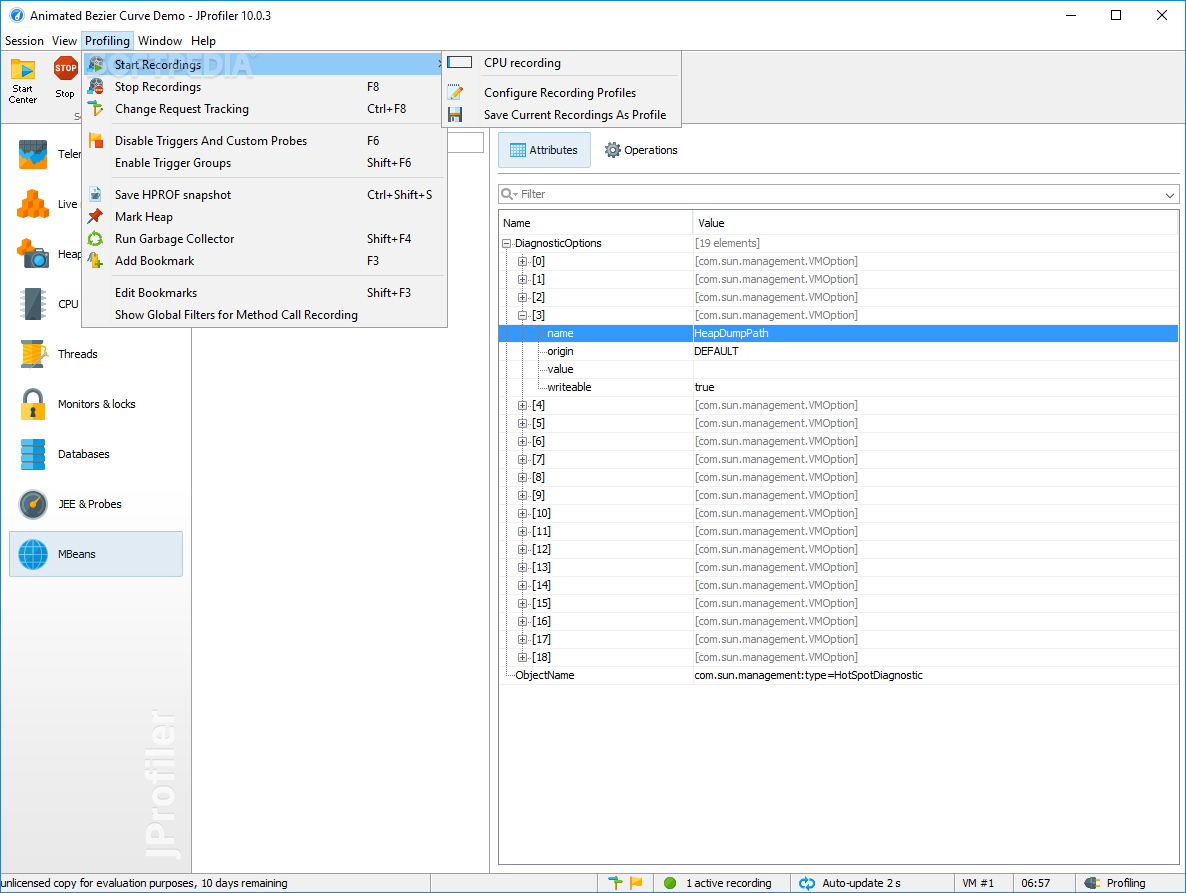
Advanced Profiling Options
With JProfiler Portable, you can override the default JDK, define filters, exceptional, ignored, and split methods for CPU profiling, and create templates with customized profiling settings. The tool offers a wide range of options for configuration, allowing you to tailor the profiling process to your specific needs.
Low System Impact
During our tests on Windows 10, JProfiler Portable demonstrated smooth performance with minimal impact on system resources. This ensures that you can analyze and resolve Java-related issues without slowing down your computer.
Download JProfiler Portable for FREE today and discover a comprehensive set of tools for identifying and resolving performance issues in your Java applications.
User Reviews for JProfiler Portable 7
-
for JProfiler Portable
JProfiler Portable offers a clean interface, powerful JVM tools, and support for Java Enterprise Edition. Ideal for analyzing and resolving Java-related issues.
-
for JProfiler Portable
JProfiler Portable is a game-changer for Java developers! The user-friendly interface and powerful features make analyzing JVM tools effortless.
-
for JProfiler Portable
Absolutely love JProfiler Portable! It helps me troubleshoot bottlenecks with ease, and the integration with IDEs is seamless.
-
for JProfiler Portable
JProfiler Portable has transformed my workflow. The ability to analyze memory leaks and database calls has greatly improved my app's performance!
-
for JProfiler Portable
As a Java programmer, I find JProfiler Portable invaluable. Its detailed profiling tools are essential for optimizing application servers.
-
for JProfiler Portable
Highly recommend JProfiler Portable! The clean layout and extensive configuration options make diagnosing issues a breeze.
-
for JProfiler Portable
JProfiler Portable is fantastic! It runs smoothly on Windows 10 and provides all the necessary tools for effective Java troubleshooting.