Description
Mark Jacobs Graph Plotter
Mark Jacobs Graph Plotter is a cool software that helps you create graphs easily! It's a neat tool for showing how different pieces of data relate to each other. Think of it like turning numbers into visuals so you can understand them better.
What Can This Software Do?
This app is super user-friendly and doesn't need any setup. You won't have to worry about messing with system registries since it's portable. That means you can run it straight from a USB drive or disk, making it super convenient!
User Interface Made Easy
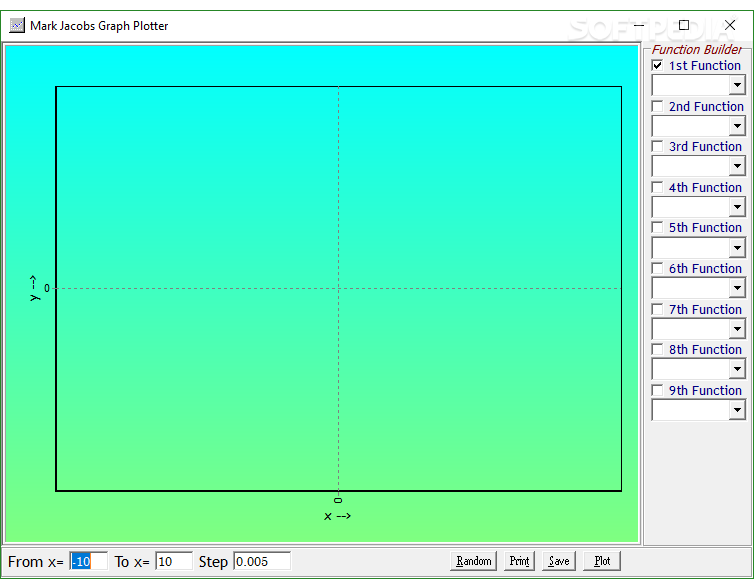
The interface is straightforward, which is awesome! You'll see eight brackets to enter your values, three brackets for setting the limits on your graph (that's for the "X" vector), and two buttons to either print or save your plot. It's all right there in front of you, simple as pie!
Why Use Graphs?
Graphs are great because they show relationships between variables in a way that's easy to digest. Instead of looking at boring lists of numbers, you can visually see how things connect! If you get the inputs right, Mark Jacobs Graph Plotter makes it quick to whip up plots that are easy to read.
Try Before You Buy!
If you're curious about how everything works, just hit the "Random" button. This will throw in some random values and switch functions around so you can see what the graph might look like without any pressure.
A Handy Tool for Specific Needs
This isn't an app everyone will use every day, but if graphs are your thing or you need them occasionally, this tool is super handy! It keeps things simple and lets you focus on making plots that make sense.
User Reviews for Mark Jacobs Graph Plotter 8
-
for Mark Jacobs Graph Plotter
Mark Jacobs Graph Plotter offers a simple but efficient way to create graphs. The UI is user-friendly, helping quickly visualize data.
-
for Mark Jacobs Graph Plotter
Mark Jacobs Graph Plotter serves as a potent math tool with a user-friendly interface, great for students.
-
for Mark Jacobs Graph Plotter
Mark Jacobs Graph Plotter is an incredible tool! It's super easy to use and perfect for visualizing data.
-
for Mark Jacobs Graph Plotter
I love this app! The interface is straightforward, and it quickly generates plots that are easy to understand.
-
for Mark Jacobs Graph Plotter
This app is fantastic for anyone needing to create graphs. Quick, portable, and user-friendly!
-
for Mark Jacobs Graph Plotter
Absolutely love Mark Jacobs Graph Plotter! It makes graphing my data a breeze with its simple design.
-
for Mark Jacobs Graph Plotter
5 stars! This app is great for instantly generating plots without any hassle. Highly recommended!

