

Description
SimpleProgramDebugger
SimpleProgramDebugger is a handy tool for developers. You know how it goes—no matter how hard you work, bugs can sneak into your software. These pesky bugs can slow things down or even crash your app. That’s why it’s super important to debug before launching your product. And guess what? This is where SimpleProgramDebugger comes in!
Easy Setup Without Installation
This utility is super easy to use because it doesn’t need any installation on your computer. Just download it, extract the files, and you're good to go! You can run it right away from wherever you saved it.
User-Friendly Interface
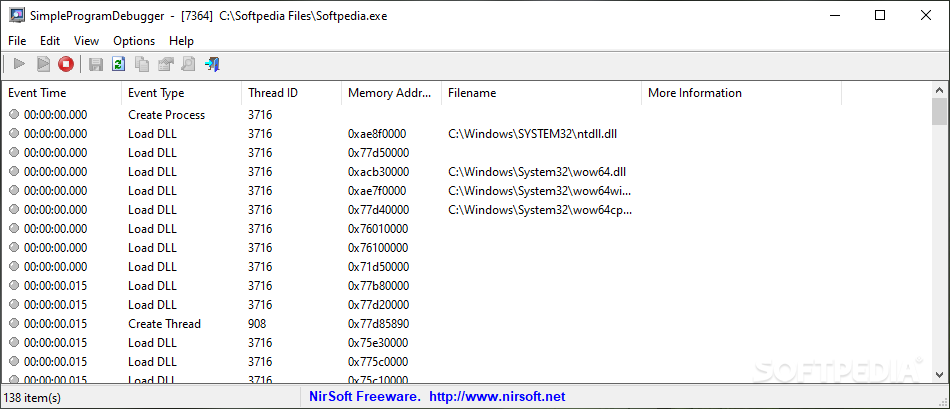
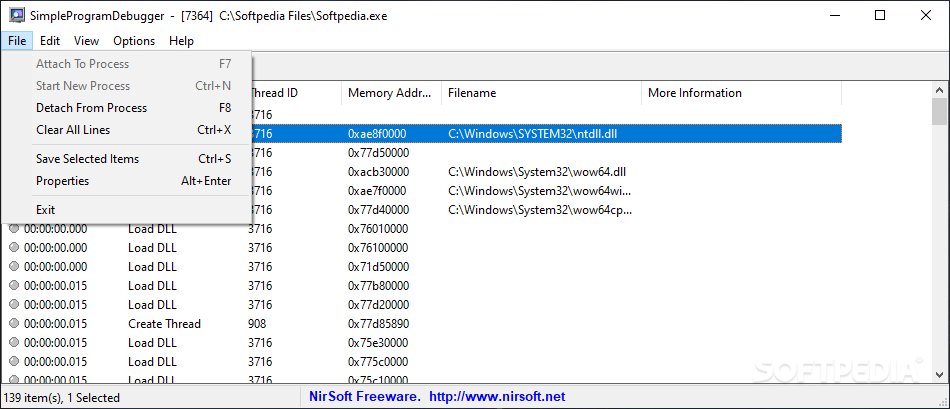
The graphic interface of SimpleProgramDebugger is really intuitive. It lets you attach the debugger to a process that’s already running or start a new one, depending on what you need at the moment.
Real-Time Debugging Events
Once you get the app running, SimpleProgramDebugger kicks in and shows all the debugging events happening with it. You'll see info like event time, type, thread ID, filename, memory address, and more details if they're available.
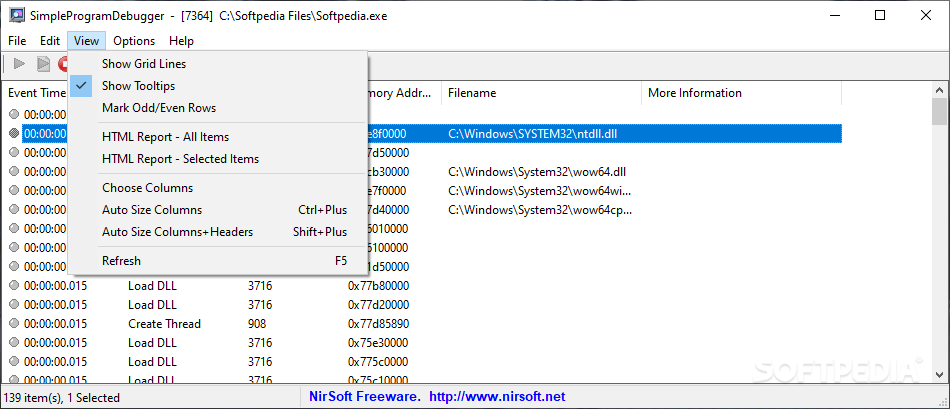
Customizable Data View
You can make all this data easier to read by adjusting column sizes or turning off columns that aren't relevant to you. If you prefer a cleaner look, you can also choose to enable or disable grid lines based on your choice.
Exporting Reports Made Easy
The reports generated by SimpleProgramDebugger are super flexible too! You can export them in formats like HTML, TXT, CSV, or XML. This way, you can analyze them later or even integrate them into other projects!
A Must-Have for Developers
If you're a developer looking to improve your app's performance and stability while debugging, SimpleProgramDebugger is definitely worth checking out! Plus, it's free! So why not give it a try? You can download it here.
User Reviews for SimpleProgramDebugger 1
-
for SimpleProgramDebugger
SimpleProgramDebugger is a user-friendly tool that aids developers in debugging software efficiently. Its export feature is a bonus.