

Description
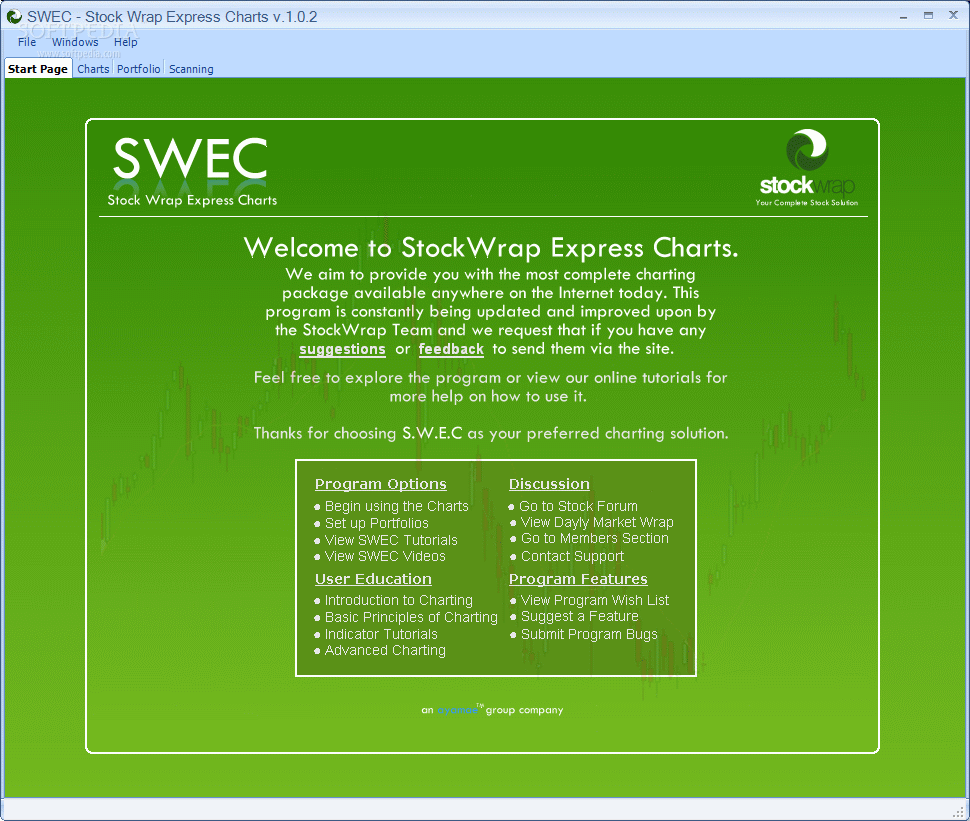
StockWrap Express Charts
StockWrap Express Charts is a totally free stock and analysis software that packs in 100 indicators and tools. It covers a whopping 50,000 stock codes from nearly every exchange around the world! Plus, it offers free live data updates, a portfolio manager, and even a scanning manager to help you keep track of everything.
Key Features of StockWrap Express Charts
Here are some cool features:
- Charting Manager for all your chart needs
- Portfolio Manager to handle your investments
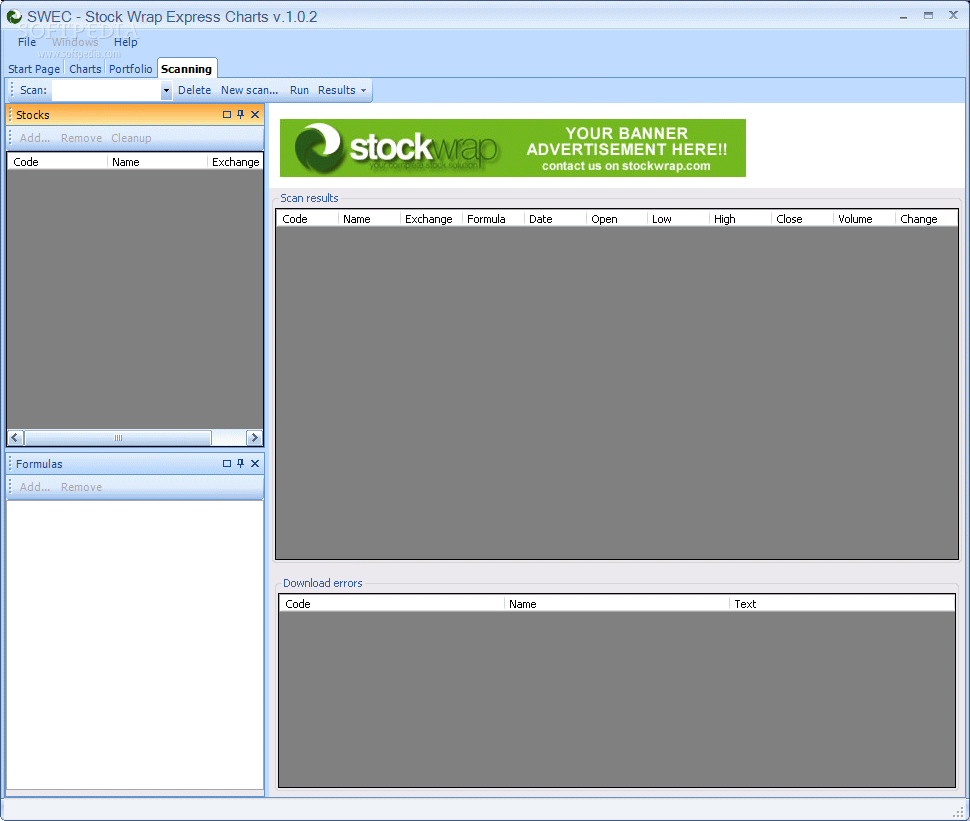
- Scanning Manager to find stocks that fit your strategy
- Stop Loss Manager to protect your investments
- Edit Data Manager for easy updates
- Data Download Panel Manager for accessing data easily
- Live Data Panel Manager to keep you updated in real-time
- Brought to you by Microsoft .NET Framework for reliability
- Multi-Screen Multi-Docking Functionality – perfect for multitaskers!
- Covers 40 Different Stock Exchanges with full symbol lists!
- Create Page and Workbook Templates for personalized layouts
- Easily arrange charts vertically or horizontally as you prefer!
- Create and save workbooks with multiple charts at once!
- Create workbooks from CSV, TXT files, and more!
- You can store data locally so you can work offline anytime!
- Smooth page and chart swapping makes it user-friendly!
- Download historical data with just a click!
- Email charts directly from the system mailer – super convenient!
- Save charts in various formats like *.JPEG, *.PNG, *.GIF, etc.
- Refresh Data feature keeps everything up-to-date!
- Lock-mouse-to-price for easier tracking of changes!
- You can contract/expand data views to suit your needs.
- Easily print charts for offline reference.
- Add or remove crosshair tools based on what you need.
- Zoom In/Out capabilities let you focus on details or get the big picture.
- Select between Day/Week/Month/Year Data Adjusting as needed.
User-Friendly Tools and Chart Options
Here's more:
- Stock Info Panel gives quick insights into stock performance.
- Tools Applied Panel shows what tools you're using right now.
- Tool Properties Panel lets you customize settings easily.
- Indicator Overlay options allow flexible chart styles at the top or bottom of your graphs.
The Different Chart Types You Can Use:
- Bar Charts - great for comparing values over time.
- Candle Stick Charts - perfect for showing price movement trends.
This software needs the Microsoft ASP.NET Framework 2.0.
User Reviews for StockWrap Express Charts 7
-
for StockWrap Express Charts
StockWrap Express Charts offers an impressive array of features like multi-screen functionality and historical data downloads. A must-have for serious investors.
-
for StockWrap Express Charts
StockWrap Express Charts is fantastic! The variety of indicators and tools is impressive, and the live data updates keep me informed. Highly recommend!
-
for StockWrap Express Charts
This app has everything I need for stock analysis. The portfolio manager and scanning features are top-notch. 5 stars all the way!
-
for StockWrap Express Charts
Absolutely love StockWrap Express Charts! It's user-friendly and packed with features that make trading much easier. A must-have for any investor!
-
for StockWrap Express Charts
Amazing app! The multi-screen functionality is a game changer for my analysis. Plus, the ability to save charts in various formats is a huge plus.
-
for StockWrap Express Charts
StockWrap Express Charts has transformed how I manage my investments. The scanning manager is incredibly useful, making it easy to find opportunities.
-
for StockWrap Express Charts
What a great tool for stock traders! With over 100 indicators and quick data refreshes, this app keeps me ahead in the market. Highly recommended!