

Description
Waterfall Chart Studio
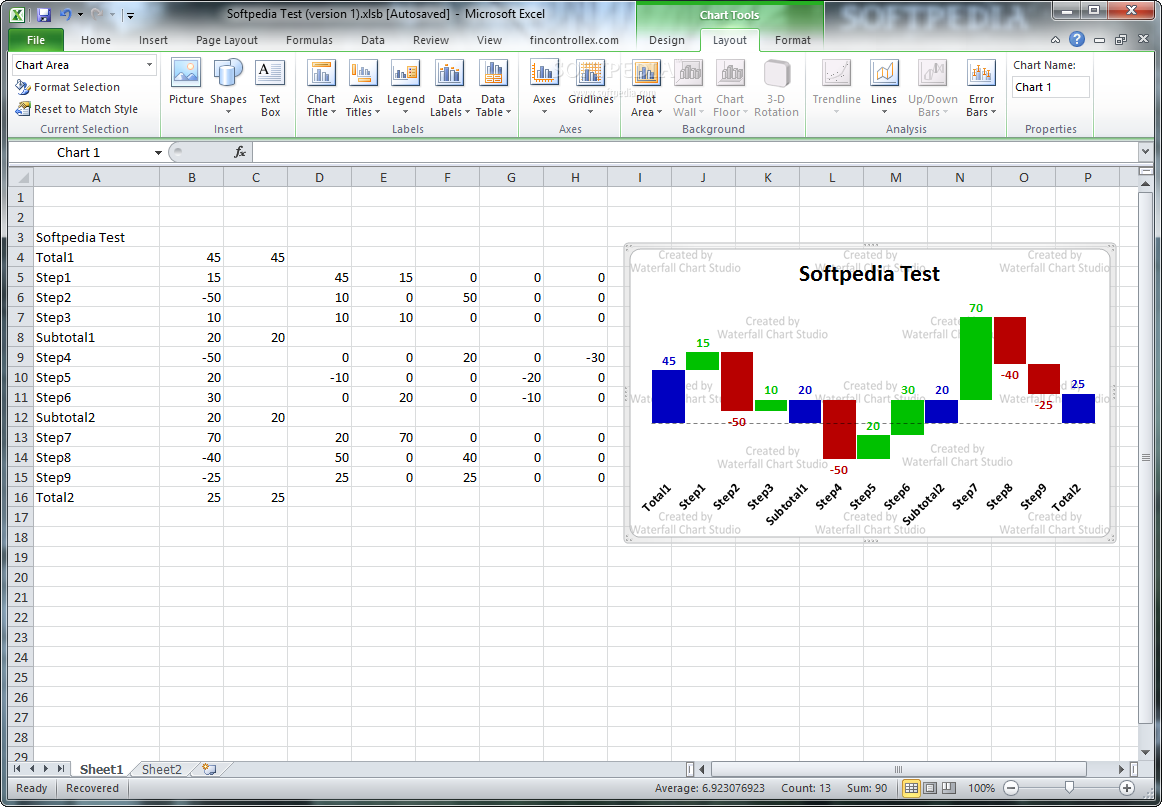
Waterfall Chart Studio is a super handy Microsoft Excel add-in that helps data analysts whip up cool visual charts from their spreadsheets in no time!
How to Get Started with Waterfall Chart Studio
While this tool is really useful, you do need to prepare your data first. It has to be in a specific format so that all the fields needed for the chart are lined up correctly. You can look at your data both vertically and horizontally, as long as you stick to the right layout.
Easy Access Right From Excel
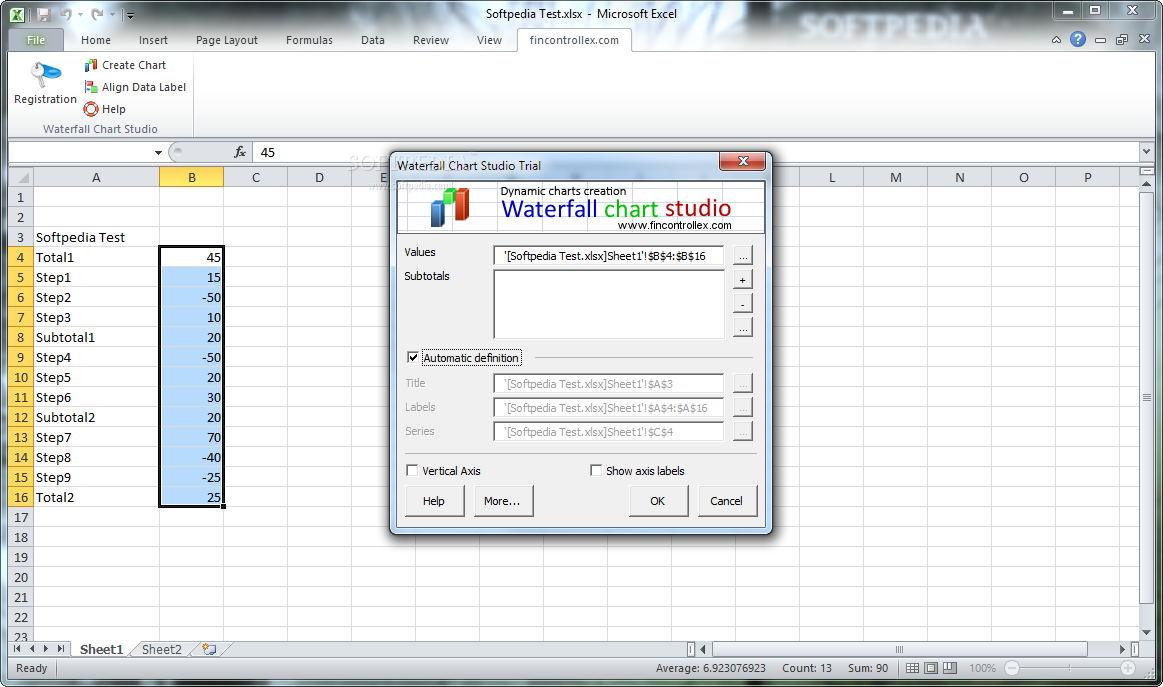
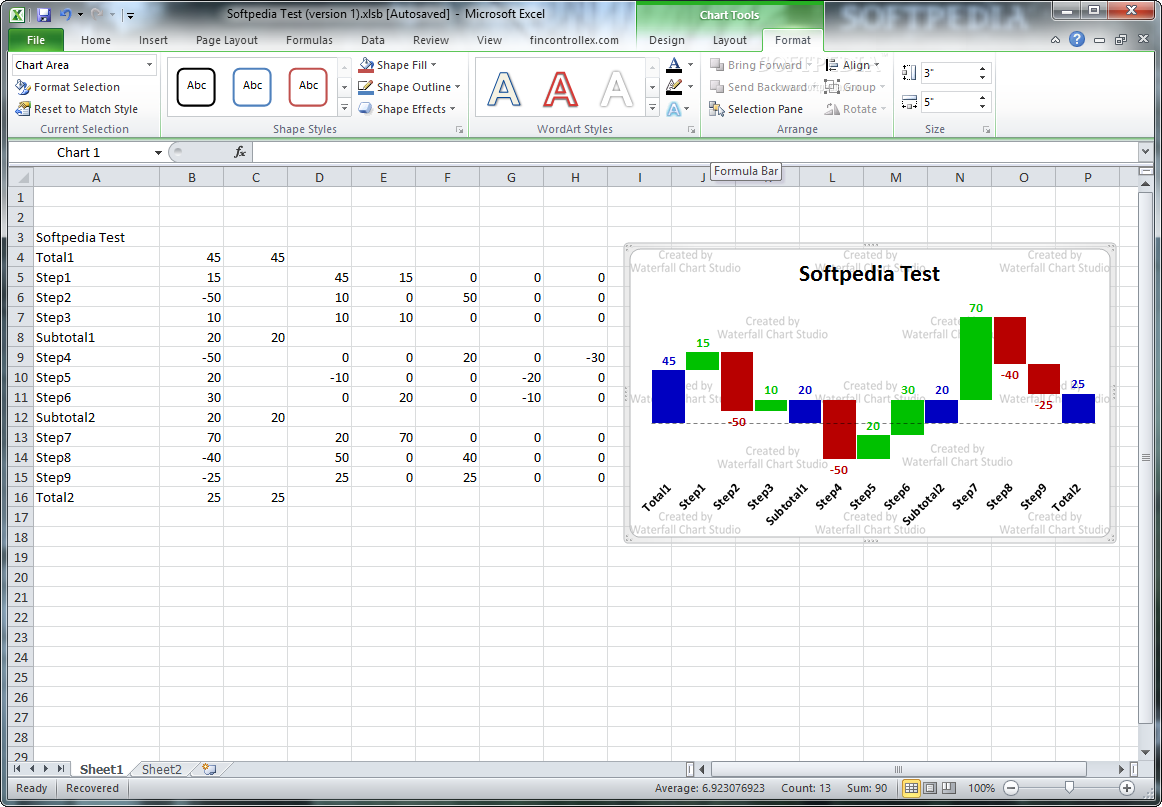
The best part? Waterfall Chart Studio fits right into your Excel ribbon, making it easy to access. Once your data is organized with 'Values', 'Labels', 'Title', and 'Range of Series', just pick the column or row for 'Values' based on how your spreadsheet is set up and hit the 'Create Chart' button!
Create Your Charts Effortlessly
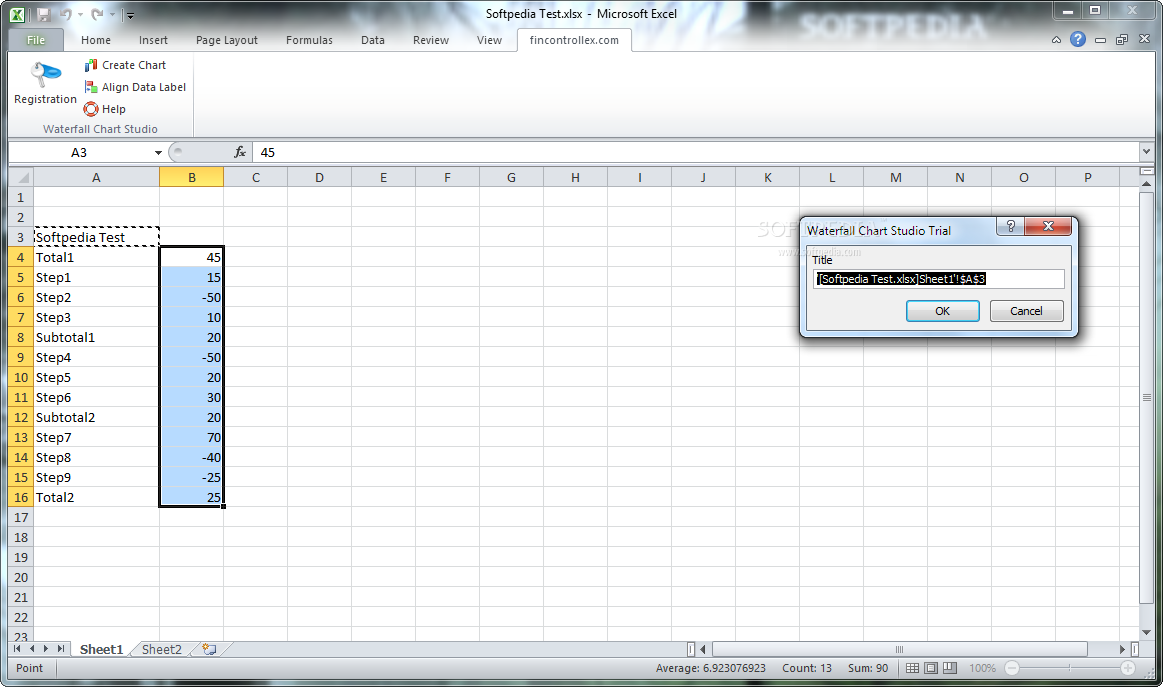
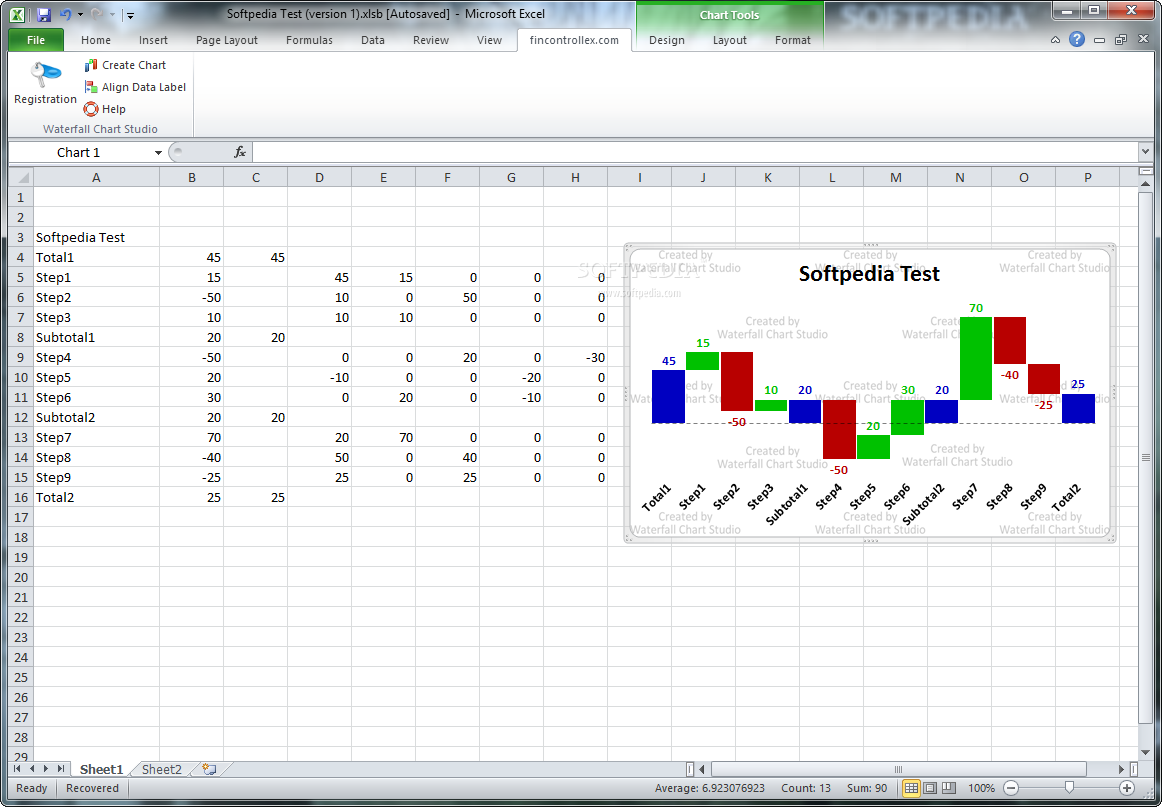
Then, a window will pop up where you can pick the right columns or rows for your data. After you enter everything needed, just click 'OK'. The extension will automatically generate a beautiful Waterfall Chart that turns those boring numbers into something eye-catching!
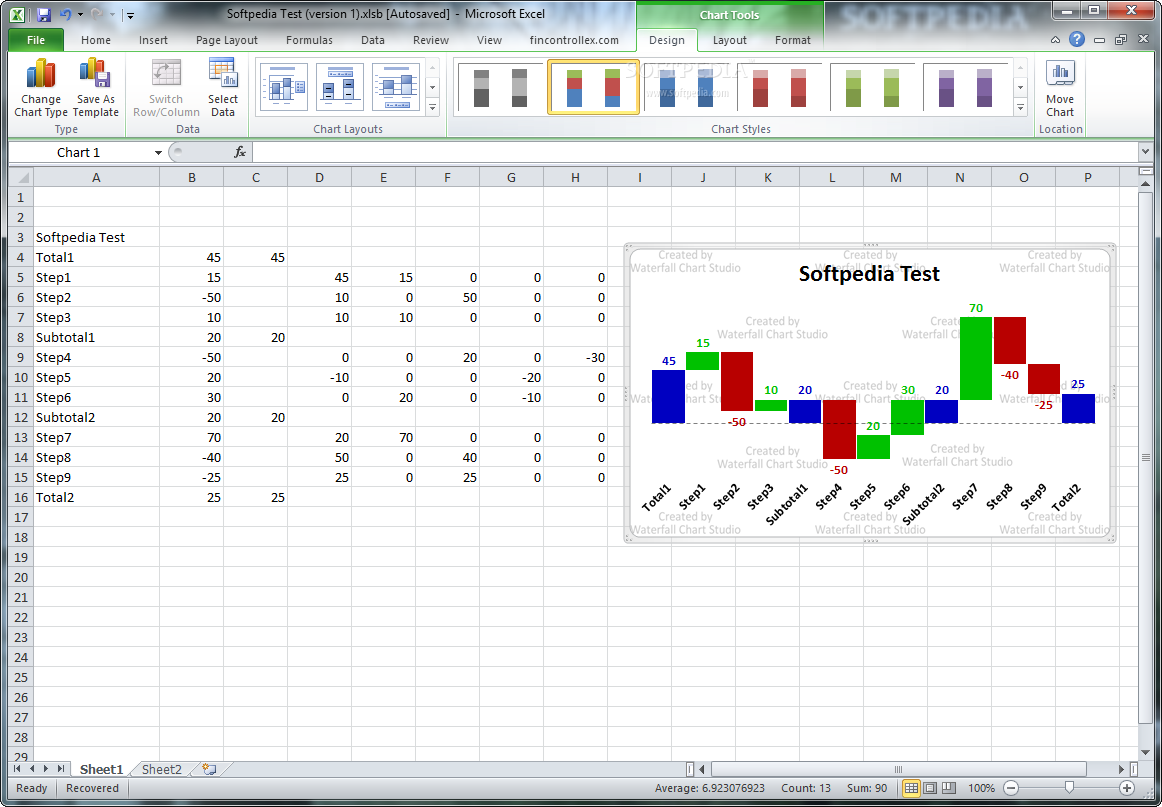
Customize Your Charts
You can even make your charts look just how you want! Change things like the chart type—whether horizontal or vertical—decide what info to show or hide, swap out fonts, titles, colors, and much more!
Dynamic Updates for Easy Use
The charts made with Waterfall Chart Studio are dynamic. That means if you tweak any numbers in your Excel sheet, those changes will automatically show up in your chart too! No extra work needed; it recalculates everything for you.
A Must-Have Tool for Data Analysts
In short, Waterfall Chart Studio is super helpful, especially if you're dealing with lots of data regularly and need quick charts. It makes things easier by automating some tasks and presenting results in a way that's much easier to read.
User Reviews for Waterfall Chart Studio 1
-
for Waterfall Chart Studio
Waterfall Chart Studio is a powerful Excel add-in for generating visual charts. Requires specific data layout but offers efficient chart creation.