
Description
Xplotter
Xplotter is a super handy software that helps you whip up all kinds of charts right from your computer. Whether you're working on a school project or just want to visualize some data, this tool has got your back!
Easy-to-Use Interface
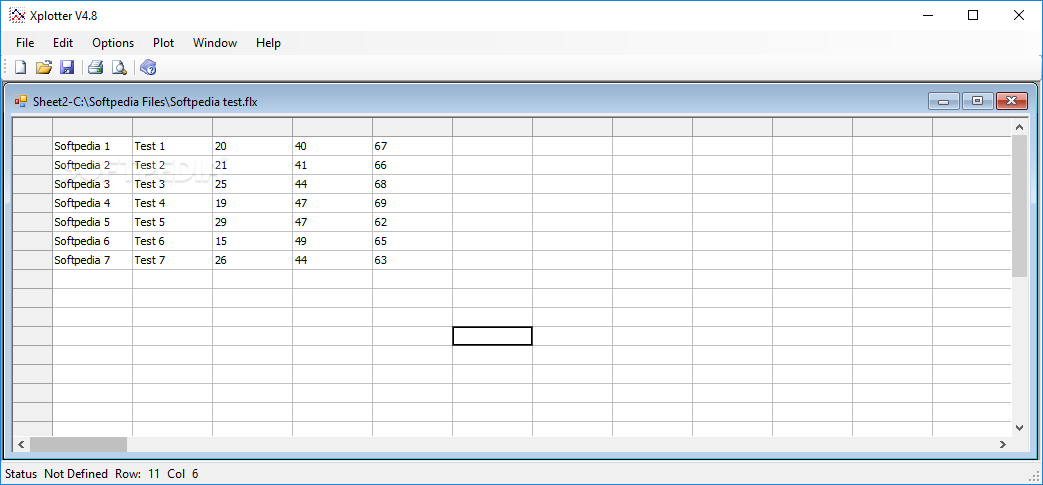
This program features a really intuitive graphical interface, making it easy for anyone to use. You’ll find everything you need in the toolbar, though there aren’t many customization options. Still, it does let you arrange your workspace and focus on what matters most.
Getting Started
If you’re new to chart-making, don’t worry! Xplotter comes with loads of instructions that guide you through creating your first chart. It’s designed to help you hit the ground running!
Data Input Made Simple
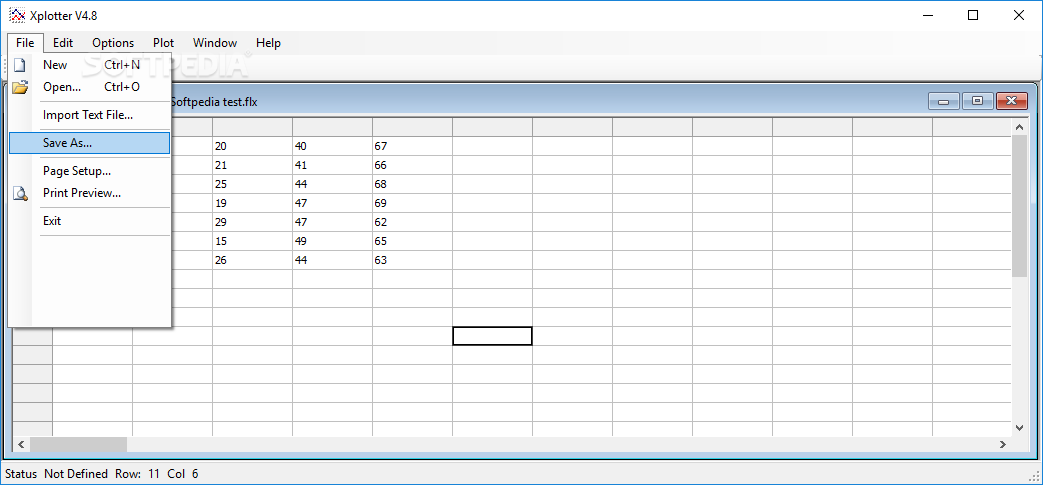
The software includes a built-in spreadsheet where you can enter and edit your data easily. Plus, it reads and writes tab-delimited ASCII files, so it works well with most spreadsheets and text editors.
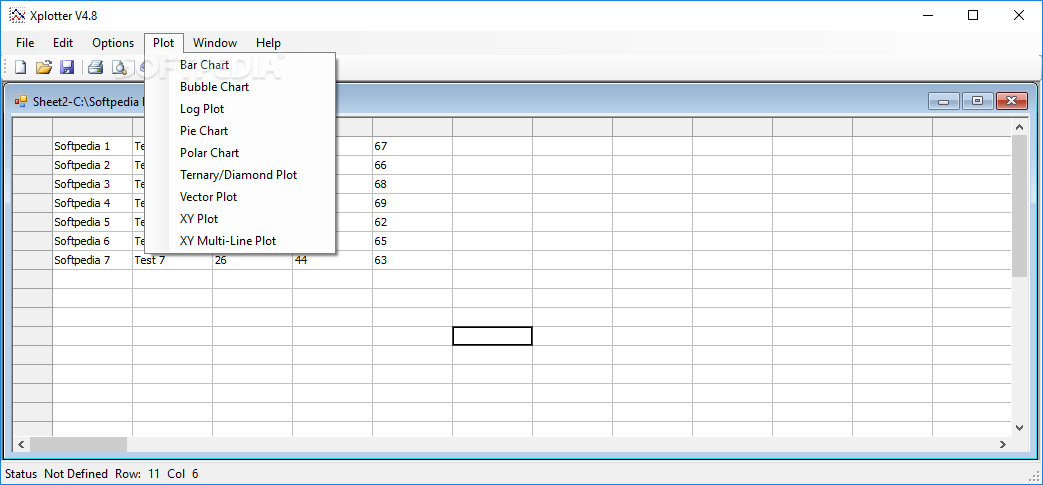
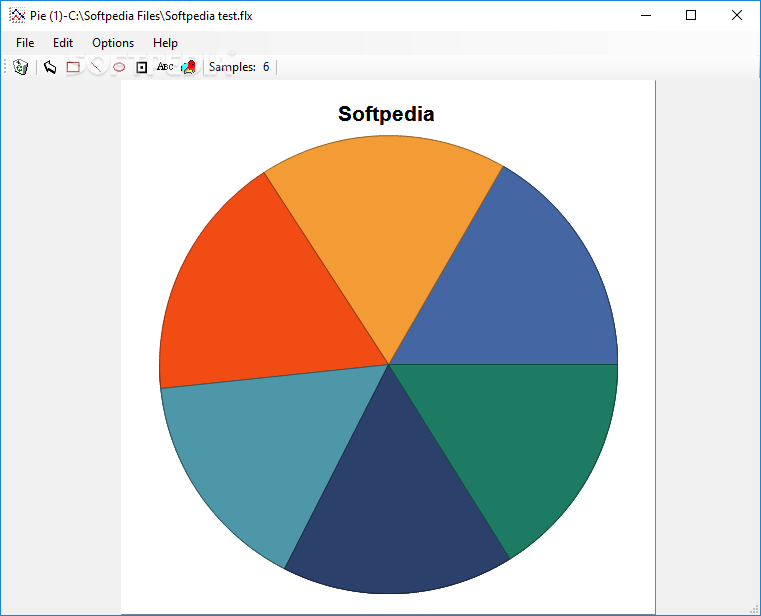
Chart Types Galore
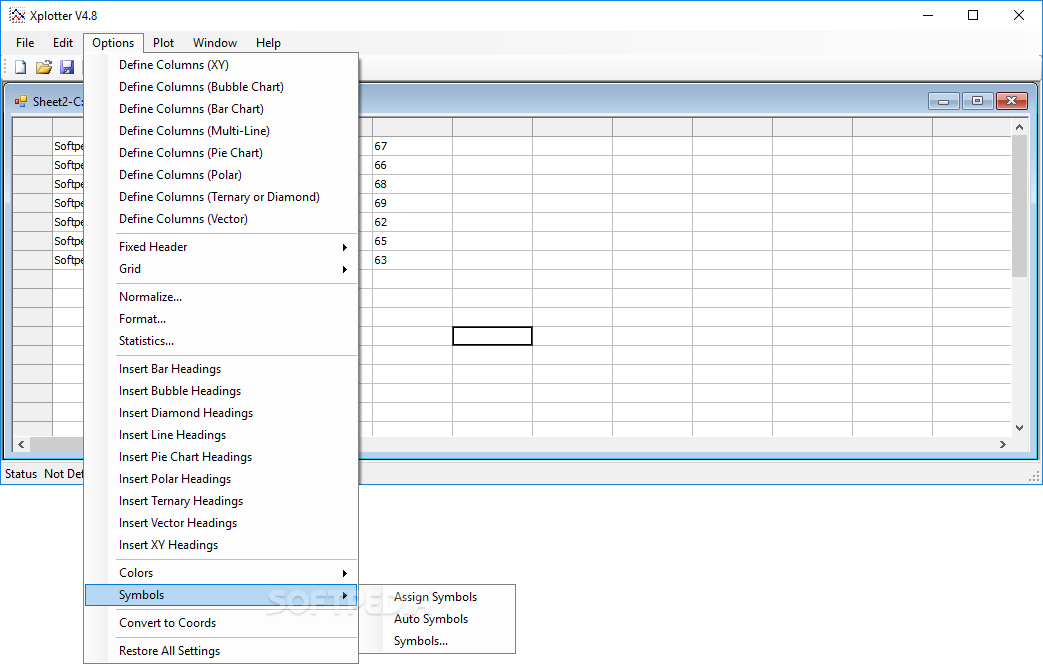
You can create all sorts of charts like XY, Log, Line, Bubble, Pie, Polar, Vector, Ternary, Diamond, and Bar Charts! And yes—these charts come in both 2D and 3D options for that extra flair.
Customizing Your Charts
Xplotter allows plenty of customization too! You can pick symbols and colors for different elements of your chart so that information pops out clearly. It also lets you add labels and titles to make everything neat.
Sorting and Printing Options
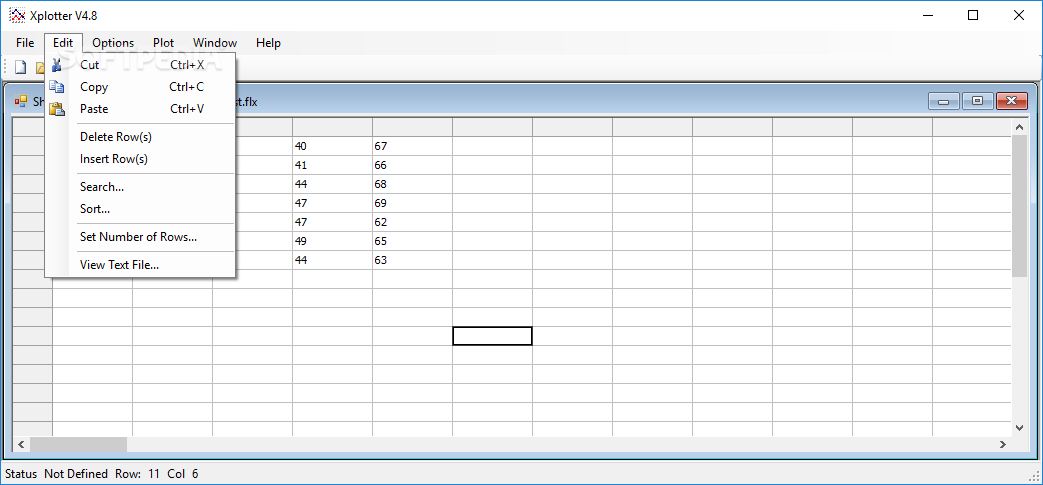
Need to sort columns? No problem! You can easily insert new columns or sort them based on different criteria. Once you're satisfied with how everything looks, printing is a breeze. All diagrams can be printed with labels or titles on any Windows printer.
Formatting Tools for Printing
Xplotter even provides tools for formatting your diagrams before printing. You can adjust size, margins, quality—whatever you need to make those charts look sharp!
If you're interested in giving Xplotter a try for creating those eye-catching charts effortlessly, check it out here.
User Reviews for Xplotter 17
-
for Xplotter
Xplotter is a user-friendly software with a variety of chart options. The built-in spreadsheet feature is intuitive and supports popular file formats.
-
for Xplotter
Xplotter offers an efficient and user-friendly plotting experience. Overall, a solid tool for data visualization.
-
for Xplotter
Impressive app with distinctive features, Xplotter could further improve stability for optimized user experience.
-
for Xplotter
Xplotter provides a smooth experience for data visualization and plotting. Minor enhancements could improve functionality.
-
for Xplotter
Xplotter offers a streamlined user experience, but lacks some advanced plotting features.
-
for Xplotter
Xplotter provides highly accurate graphing; a good tool for both learners and professionals needing comprehensive plotting solutions.
-
for Xplotter
Xplotter is an intuitive application with user-friendly interface and impressive plotting capabilities.